| Total | 1,172 (19.0%) (17.2 - 21.0) | 2,710 (58.7%) (56.5 - 61.0) | 648 (9.6%) (8.6 - 10.7) | 737 (12.6%) (11.2 - 14.2) | - |
| Sex | | | | | |
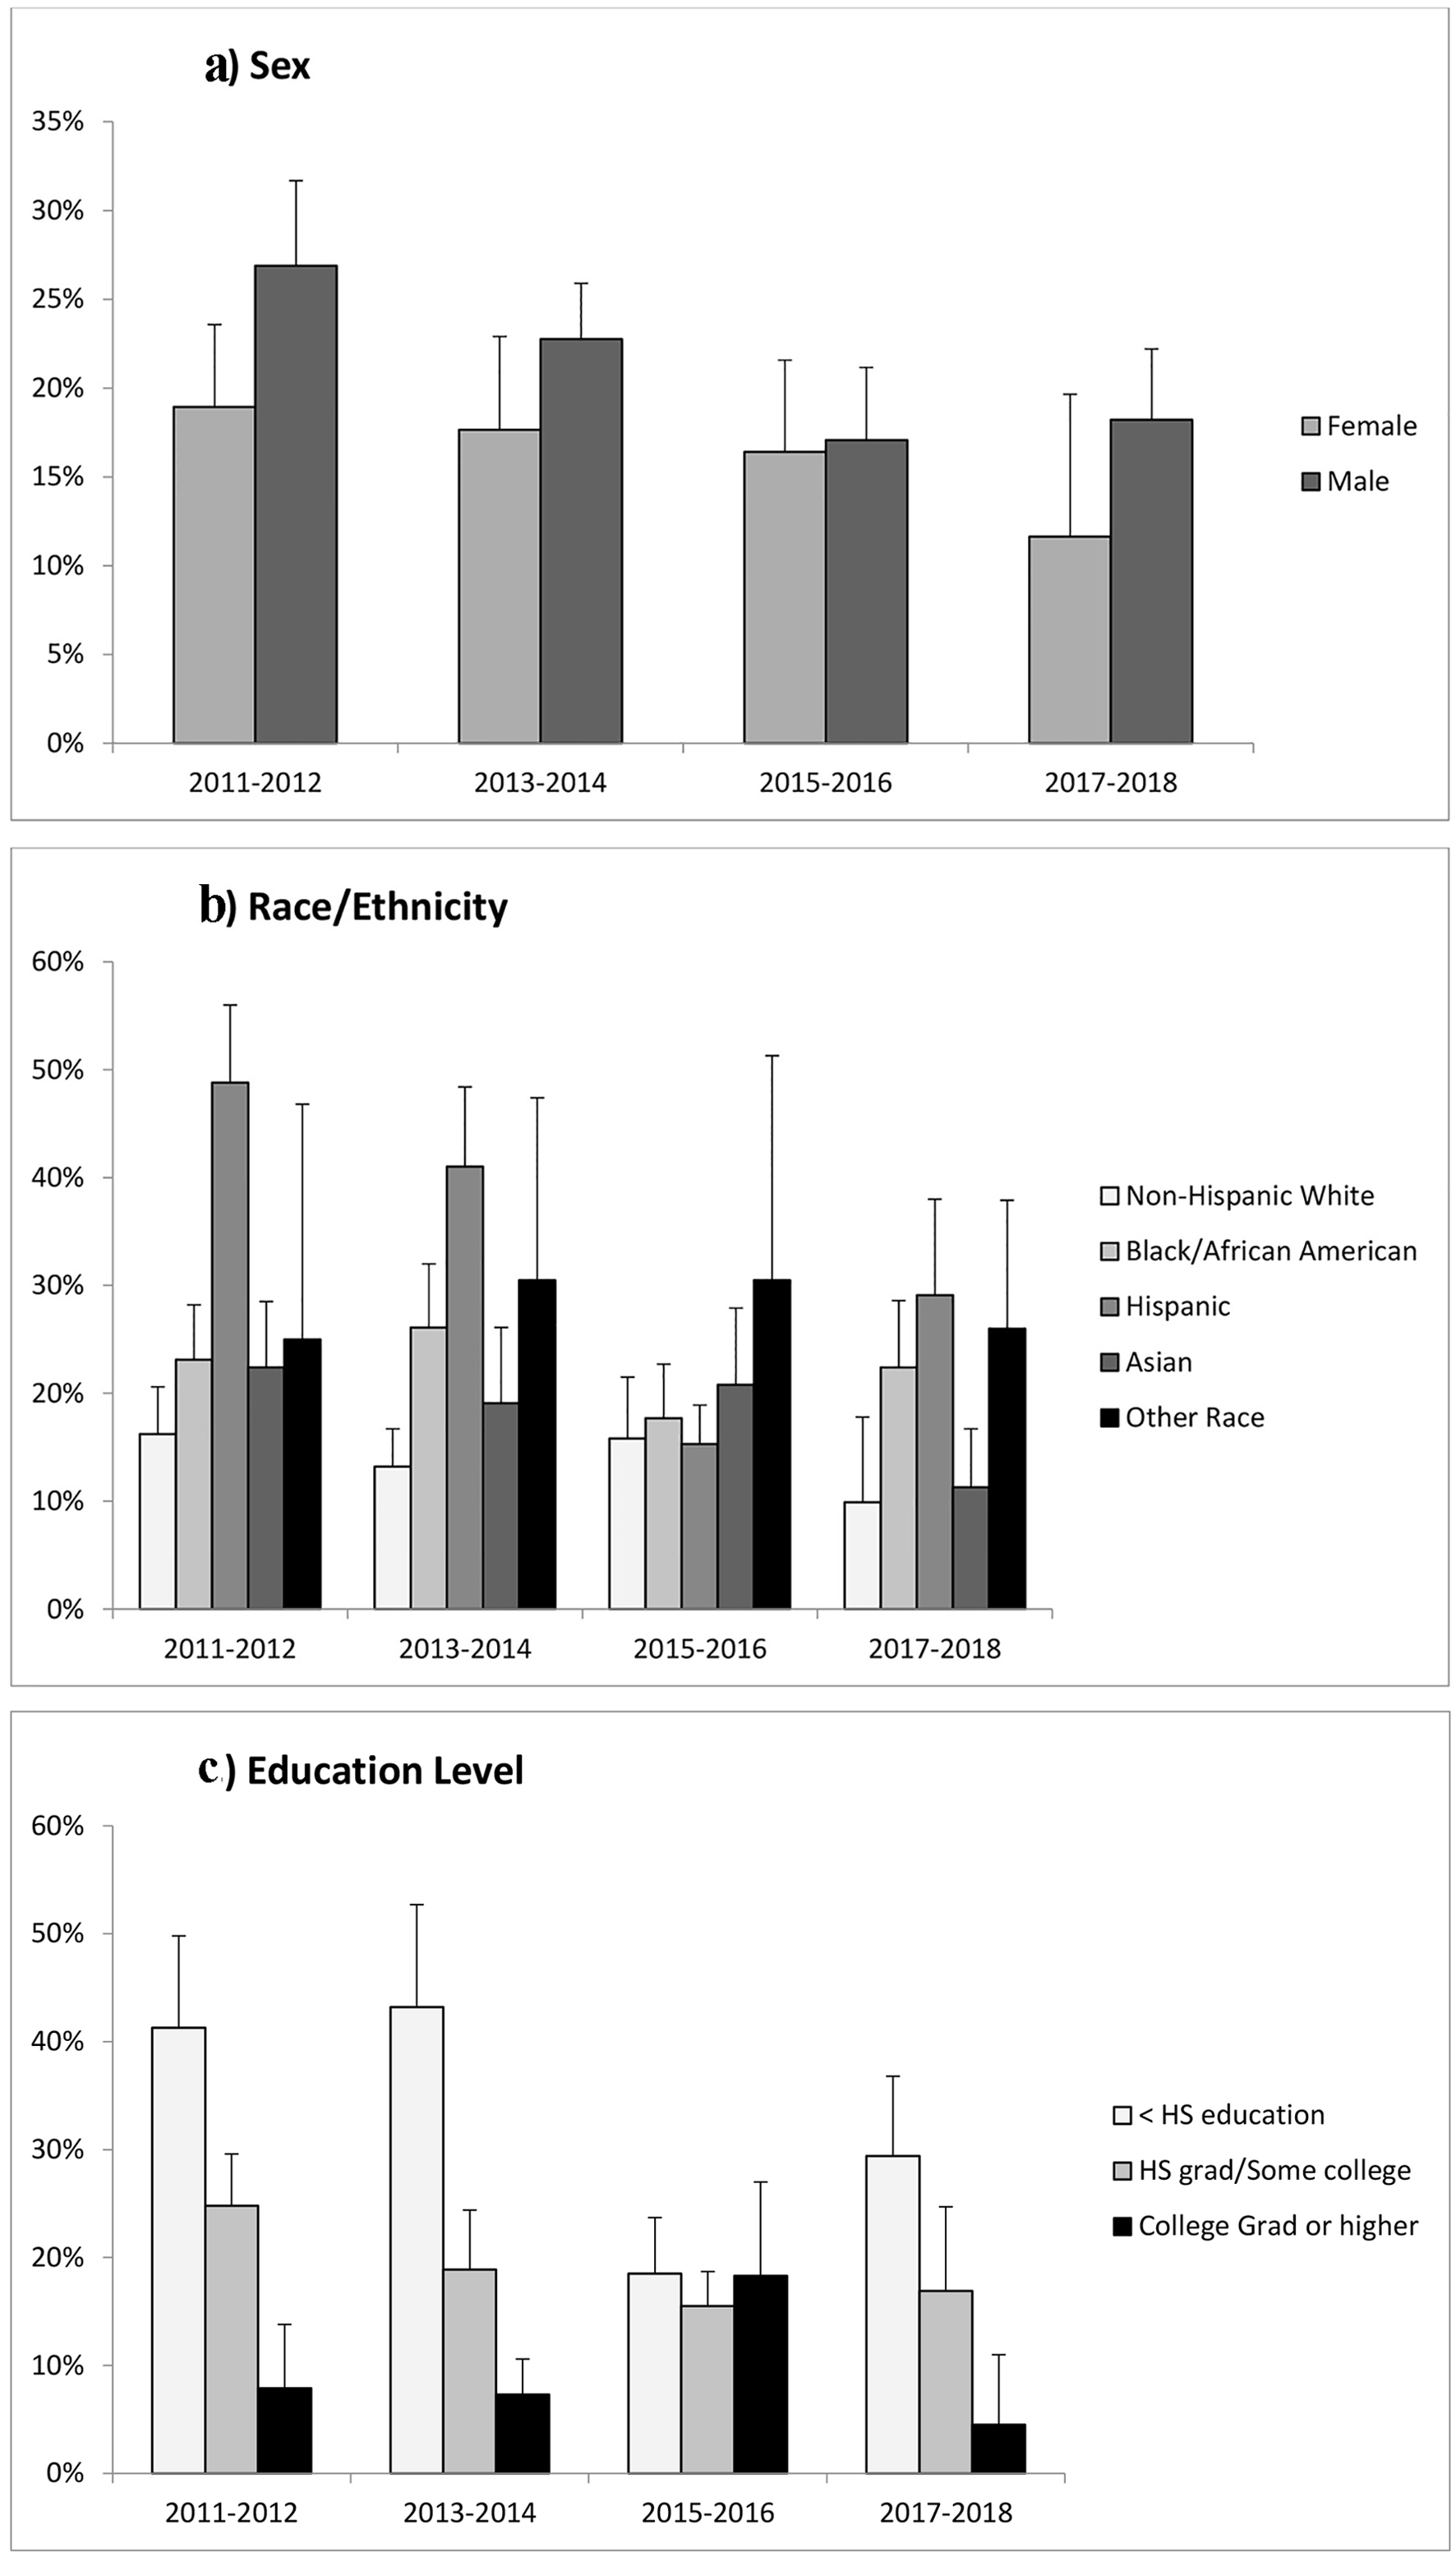
| Female | 465 (16.40%) (14.66 - 18.30) | 1,254 (61.00%) (58.11 - 63.81) | 278 (9.19%) (7.90 - 10.67) | 355 (13.41%) (11.49 - 15.59) | < 0.01 |
| Male | 707 (21.15%) (18.63 - 23.91 | 1,456 (56.92%) (53.97 - 59.83) | 370 (9.91%) (8.50 - 11.52) | 382 (12.02%) (10.50 - 13.72) | |
| Race/ethnicity | | | | | |
| Non-Hispanic White | 331 (13.93%) (11.76 - 16.42) | 1,134 (64.77%) (61.93 - 67.51) | 250 (9.86%) (8.43 - 11.50) | 223 (11.44%) (9.71 - 13.43) | < 0.001 |
| African American | 193 (22.36%) (18.63 - 26.59) | 441 (47.30%) (43.10 - 51.55) | 120 (9.50%) (7.65 - 11.75) | 181 (20.83%) (17.15 - 25.07) | |
| Hispanic | 488 (33.51%) (29.79 - 37.44) | 709 (44.59%) (41.17 - 48.07) | 181 (7.83%) (6.48 - 9.43) | 249 (14.07%) (11.75 - 16.76) | |
| Asian | 104 (18.63%) (15.14 - 22.71) | 335 (59.22%) (53.78 - 64.44) | 69 (11.56%) (8.31 - 15.85) | 56 (10.60%) (7.08 - 15.58) | |
| Other | 56 (28.27%) (20.62 - 37.42) | 91 (50.42%) (39.84 - 60.96) | 28 (11.52%) (7.35 - 17.61) | 28 (9.79%) (6.56 - 14.37) | |
| Age groups | | | | | |
| 18 - 44 years | 634 (25.79%) (23.04 - 28.75) | 1,056 (55.94%) (52.90 - 58.94) | 71 (3.53%) (2.44 - 5.08) | 346 (14.74%) (12.75 - 16.97) | < 0.001 |
| 45 - 64 years | 435 (17.38%) (15.23 - 19.77) | 1,080 (63.80%) (60.88 - 66.62) | 147 (5.25%) (4.18 - 6.56) | 302 (13.57%) (11.88 - 15.46) | |
| 65 years and over | 103 (7.61%) (5.43 - 10.58) | 574 (54.48%) (50.22 - 58.68) | 430 (31.80%) (28.00 - 35.85) | 89 (6.11%) (4.21 - 8.80) | |
| Country of birth | | | | | |
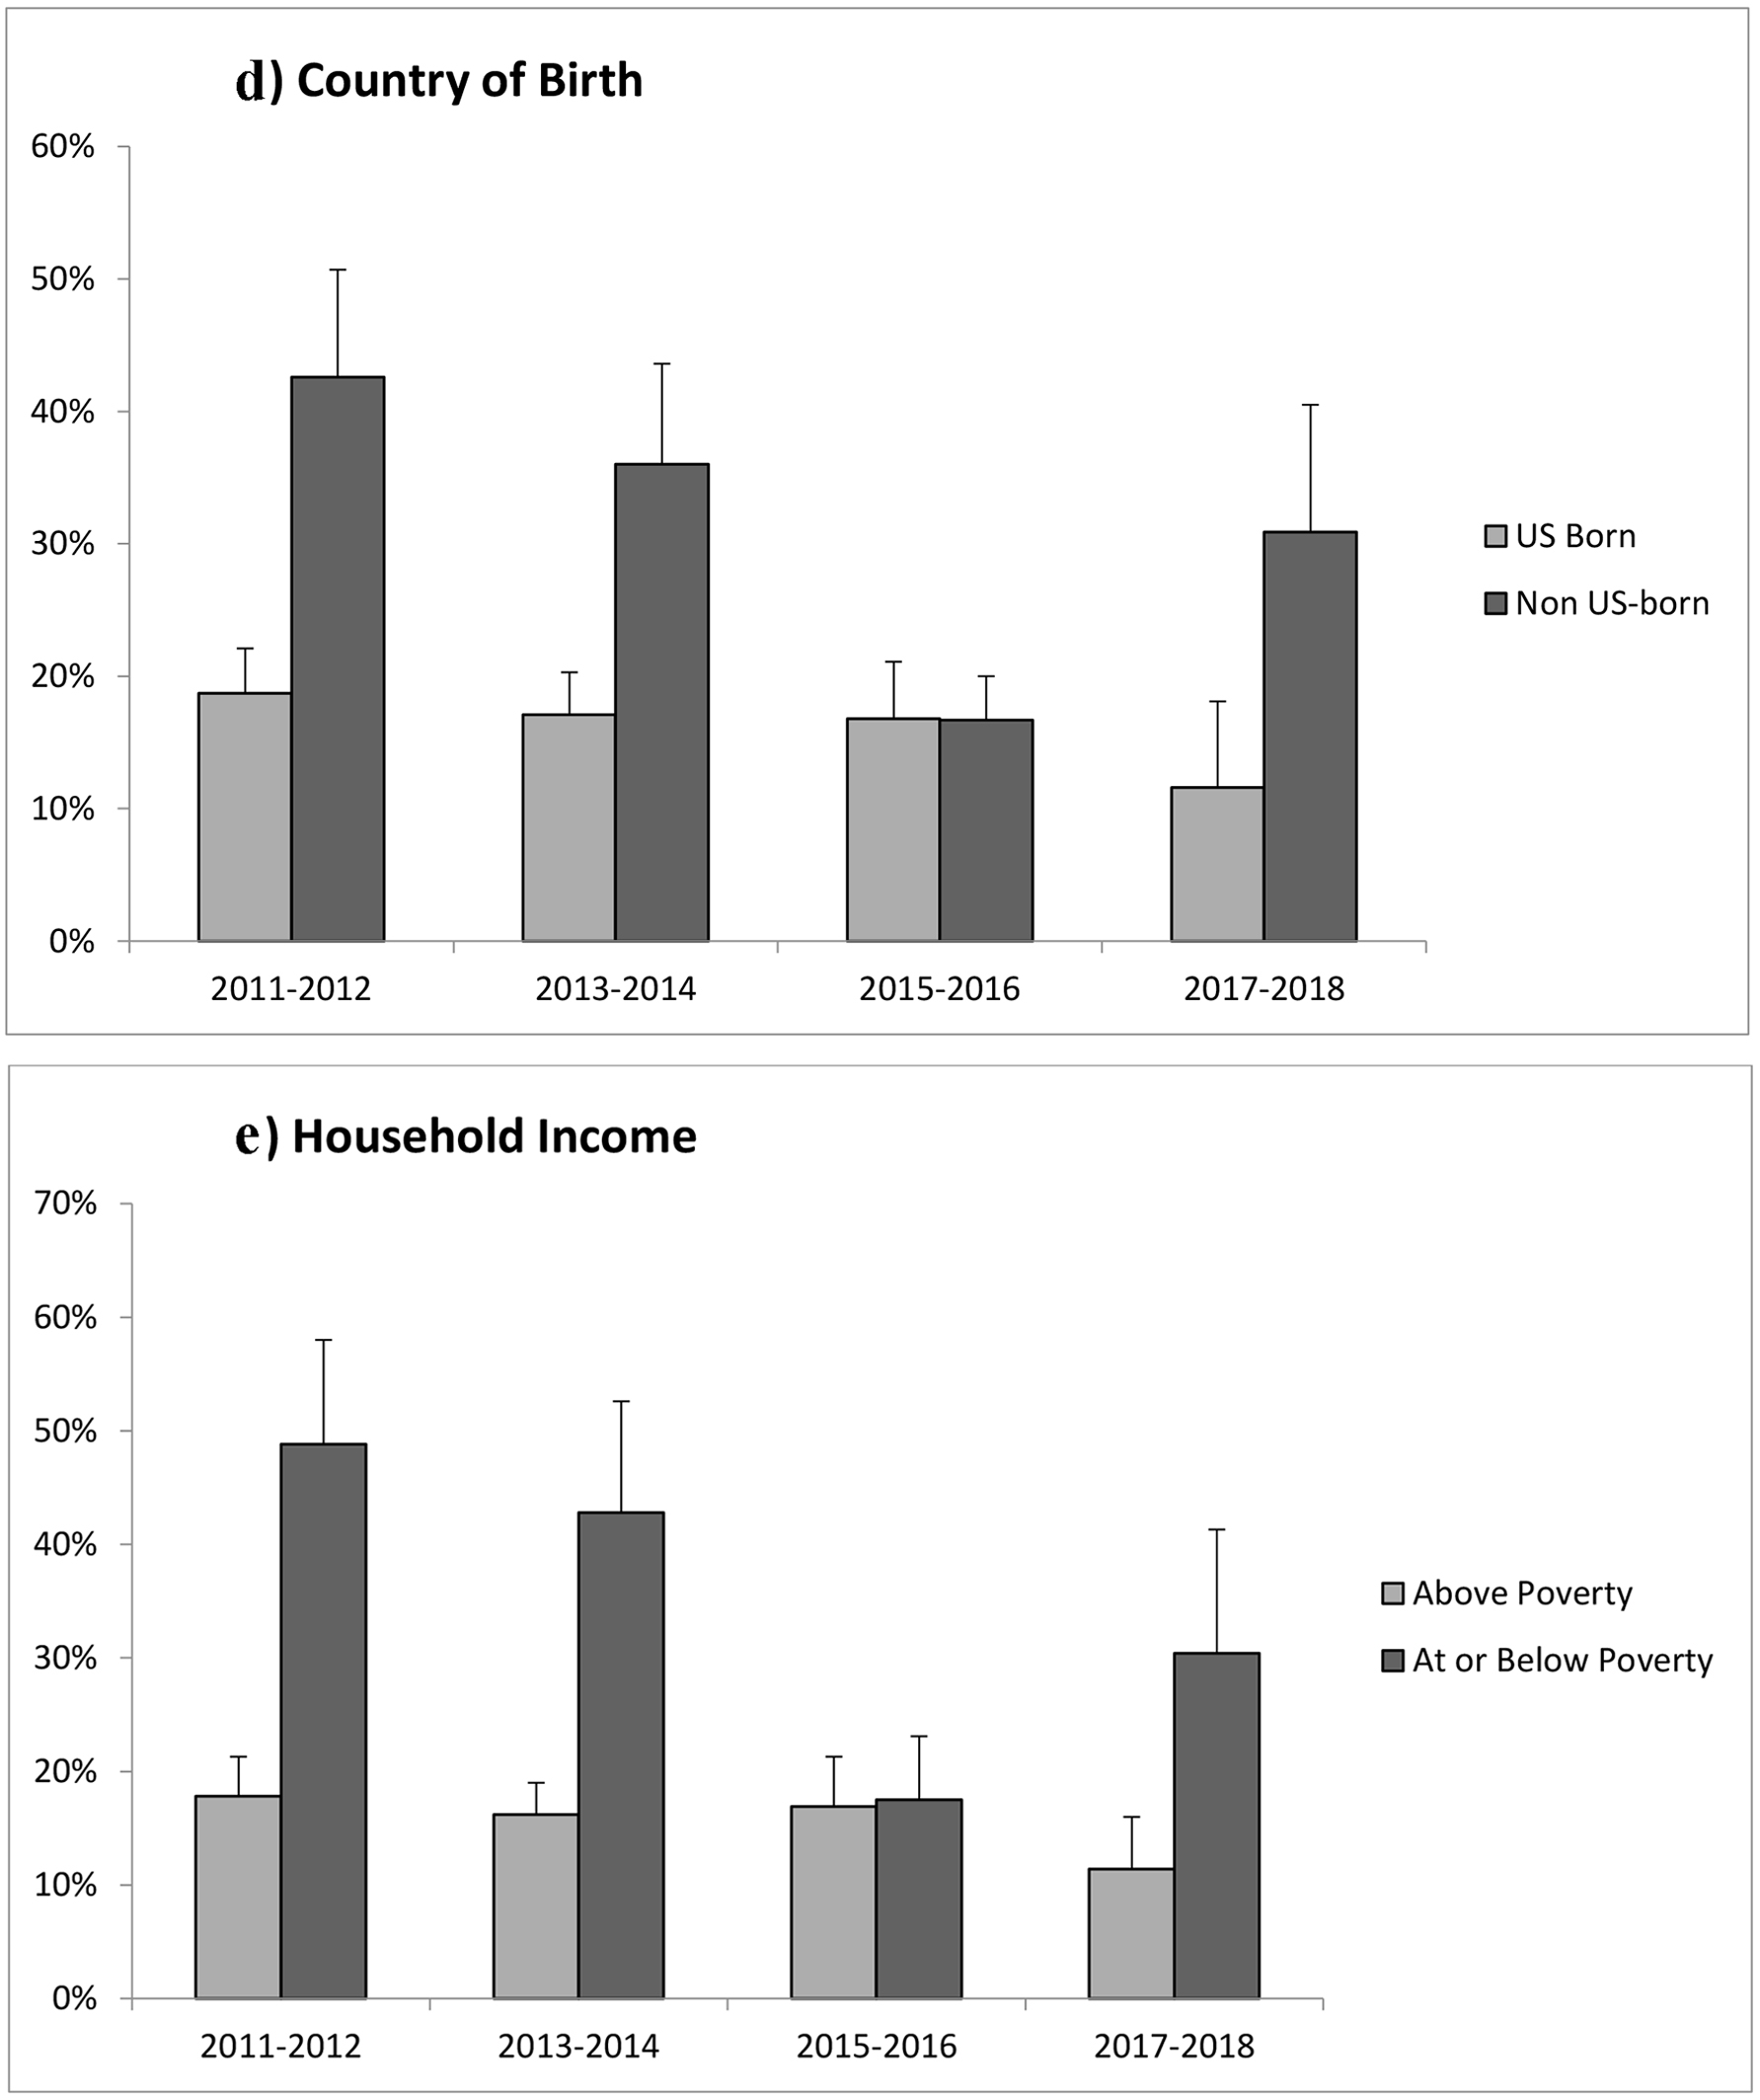
| US born | 696 (16.19%) (14.36 - 18.20) | 1,949 (61.27%) (58.76 - 63.72) | 446 (9.77%) (8.58 - 11.11) | 518 (12.77%) (11.19 - 14.53) | < 0.001 |
| Non-US born | 473 (31.86%) (28.17 - 35.78) | 758 (47.26%) (43.62 - 50.93) | 202 (8.80%) (7.24 - 10.65) | 219 (12.09%) (9.97 - 14.57) | |
| Comorbidities | | | | | |
| Diabetes | 223 (15.06%) (12.60 - 17.90) | 616 (53.88%) (49.78 - 57.93) | 276 (18.04%) (15.22 - 21.25) | 177 (13.02%) (10.51 - 16.02) | < 0.001 |
| Metabolic syndrome | 585 (17.48%) (15.45 - 19.72) | 1,458 (58.17%) (55.40 - 60.89) | 432 (11.54%) (10.11 - 13.15) | 395 (12.80%) (11.06 - 14.78) | < 0.001 |
| Hypertension | 545 (16.49%) (14.50 - 18.70) | 1,457 (57.67%) (54.91 - 60.38) | 483 (12.64%) (11.18 - 14.26) | 414 (13.20%) (11.27 - 15.40) | < 0.001 |
| Dyslipidemia | 1,061 (19.0%) (17.07 - 21.10) | 2,464 (58.50%) (56.14 - 60.83) | 601 (9.76%) (8.69 - 10.95) | 670 (12.74%) (11.21 - 14.45) | |
| Presence of advanced fibrosis | 168 (17.50%) (14.32 - 21.22) | 398 (57.10%) (52.52 - 61.57) | 116 (11.64%) (9.16 - 14.69) | 108 (13.75%) (10.76 - 17.42) | 0.3 |
| Education level | | | | | |
| Lower than high school education | 416 (33.68%) (29.87 - 37.71) | 433 (37.77%) (33.79 - 41.92) | 213 (12.76%) (10.01 - 16.13) | 201 (15.79%) (13.39 - 18.53) | < 0.001 |
| High school graduation/some college | 591 (18.92%) (16.61 - 21.48) | 1,427 (59.54%) (56.72 - 62.30) | 318 (8.60%) (7.50 - 9.85) | 385 (12.94%) (11.02 - 15.12) | |
| College graduation or higher | 126 (10.25%) (7.79 - 13.38) | 783 (70.58%) (66.18 - 74.63) | 113 (10.13%) (7.47 - 13.60) | 109 (9.03%) (7.05 - 11.51) | |
| Poverty status | | | | | |
| Above poverty | 654 (15.68%) (14.03 - 17.48) | 2,170 (64.77%) (62.41 - 67.05) | 424 (9.33%) (8.18 - 10.64) | 394 (10.22%) (8.81 - 11.82) | < 0.001 |
| At or below poverty | 393 (35.28%) (30.83 - 39.99) | 315 (28.35%) (23.83 - 33.36) | 149 (10.24%) (8.53 - 12.23) | 269 (26.13%) (22.76 - 29.82) | |
| Year | | | | | |
| 2011 - 2012 | 373 (23.29%) (19.95 - 27.00) | 668 (61.93%) (57.08 - 66.55) | 174 (9.08%) (7.11 - 11.53) | 123 (5.70%) (3.81 - 8.44) | < 0.001 |
| 2013 - 2014 | 345 (20.36%) (17.11 - 24.05) | 777 (63.77%) (58.50 - 68.73) | 172 (9.38%) (8.04 - 10.91) | 122 (6.49%) (4.71 - 8.87) | |
| 2015 - 2016 | 248 (16.77%) (13.59 - 20.51) | 705 (51.16%) (48.32 - 54.00) | 106 (7.49%) (5.96 - 9.38) | 317 (24.58%) (20.96 - 28.61) | |
| 2017 - 2018 | 206 (15.58%) (11.20 - 21.27) | 560 (58.56%) (53.84 - 63.12) | 196 (12.87%) (10.11 - 16.23) | 175 (13.00%) (9.99 - 16.74) | |