| Patients | N = 62 | |
| Gender (male/female) | 37/25 | |
| Mean age (years) | 50.65 (25 - 81) | |
| Genotype (GT) | | Therapy |
| GT1 (1a/1b/unknown) | 44 (10/30/4) | RBV/IFN (n = 3), TVR/IFN/RBV (n = 17), BOC/IFN/RBV (n = 2), SOF/LDV +/-RBV (n = 17), SOF/DCV (n = 3), SOF/RBV (n = 1), SOF/SMV/RBV (n = 1) |
| GT2 | 5 | SOF/DCV +/- RBV (n = 2), SOF/DCV (n = 1), SOF/RBV (n = 2) |
| GT3 | 10 | RBV/IFN (n = 3), SOF/DCV +/- RBV (n = 6), SOF/IFN/RBV (n = 1) |
| GT4 | 3 | SOF/IFN/RBV (n = 1), SOF/RBV (n = 1), SOF/LDV/RBV (n = 1) |
| Pre-treatment | Post-treatment |
| Mean HCV-RNA (U/mL) | 3,070,943 (48,837-12,831,248) | 0 |
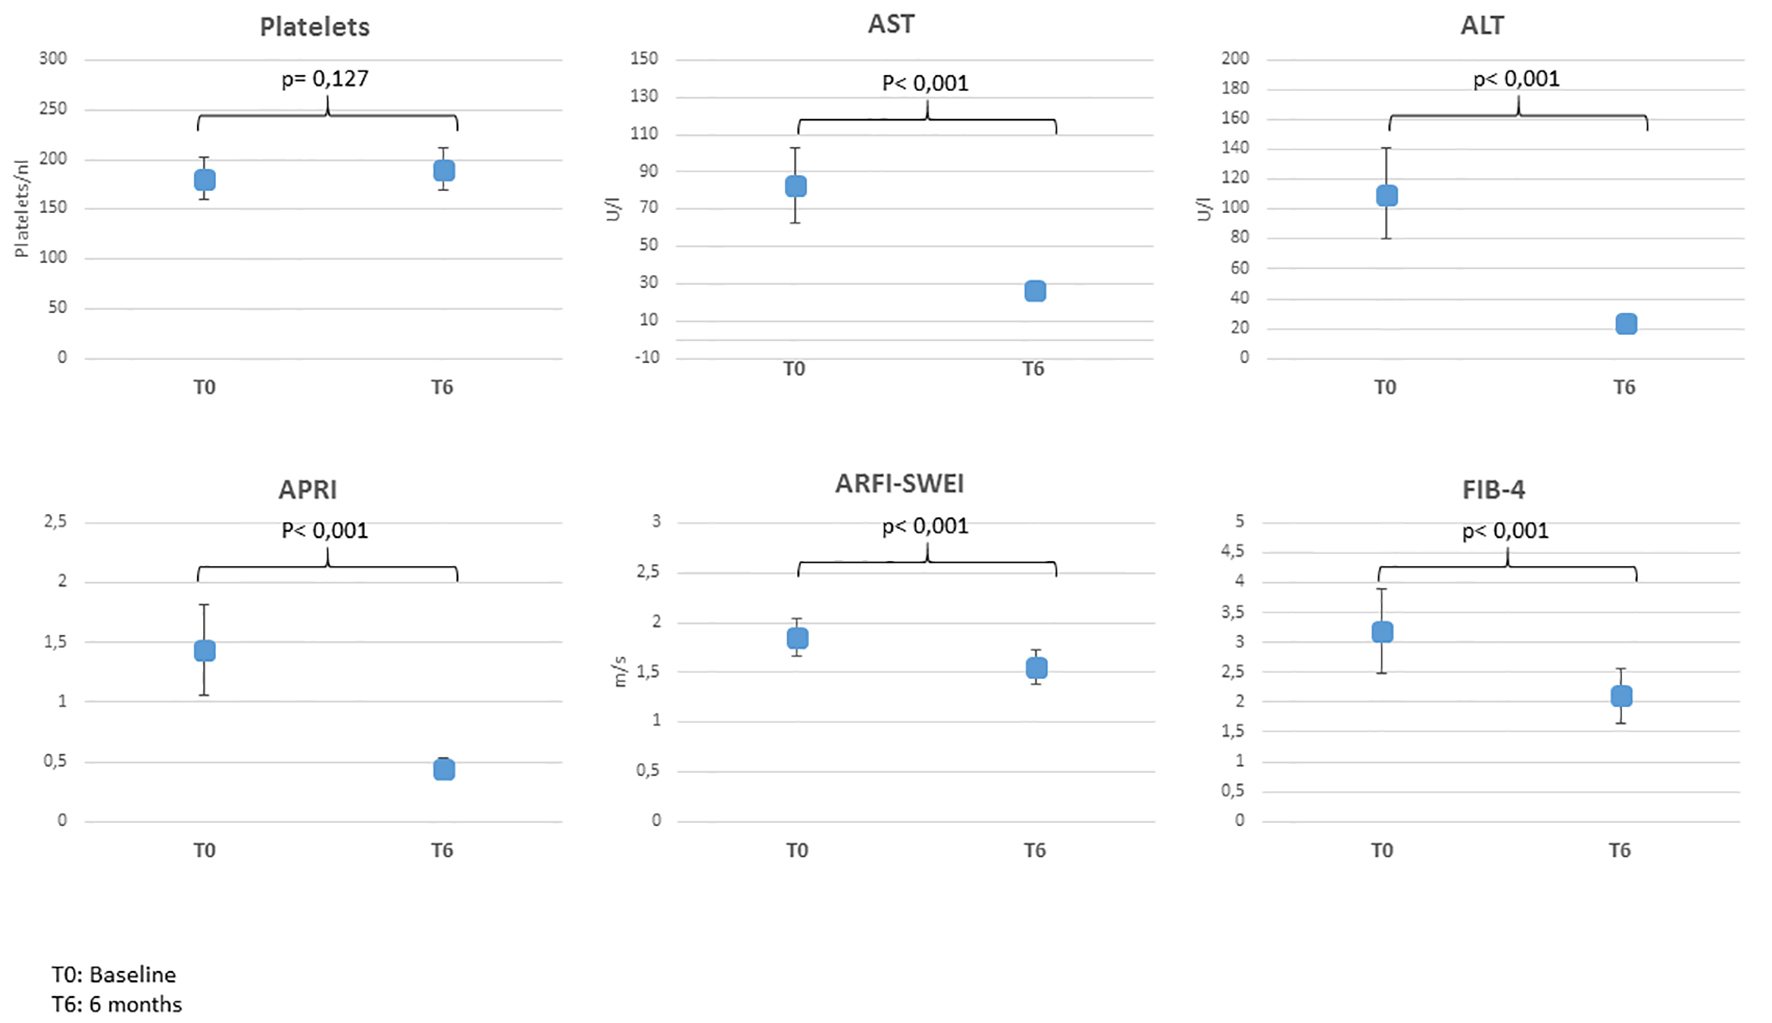
| ARFI-SWEI | | |
| F0-1 | 15 (24%) | 27 (44%) |
| F2 | 15 (24%) | 19 (31%) |
| F3 | 11 (18%) | 3 (5%) |
| F4 | 21 (34%) | 13 (21%) |