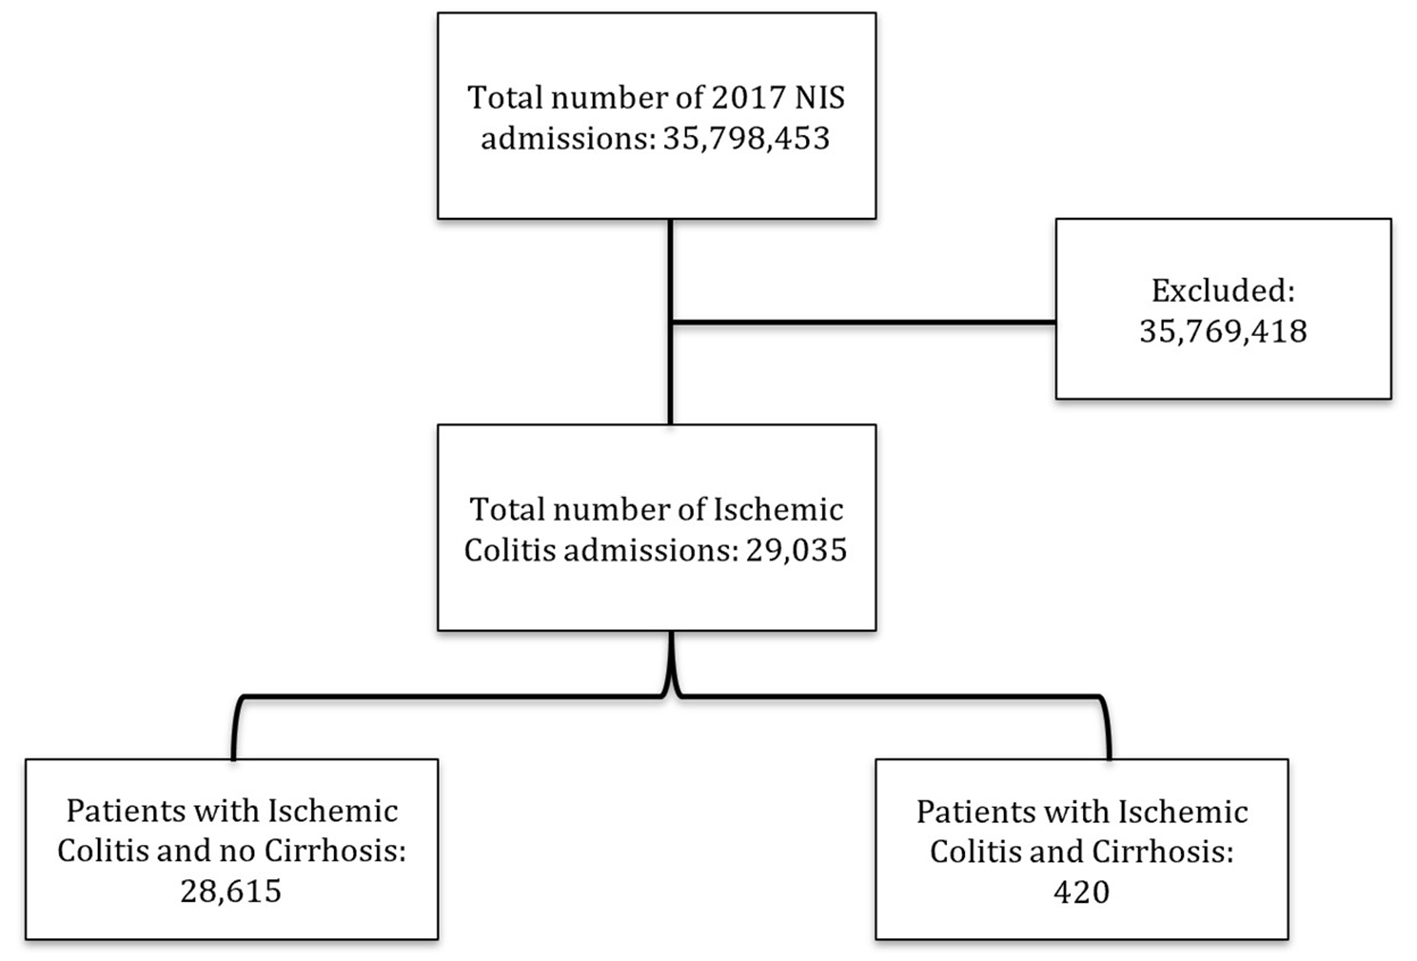
Figure 1. Flow diagram of patient selection.
| Gastroenterology Research, ISSN 1918-2805 print, 1918-2813 online, Open Access |
| Article copyright, the authors; Journal compilation copyright, Gastroenterol Res and Elmer Press Inc |
| Journal website https://www.gastrores.org |
Original Article
Volume 13, Number 6, December 2020, pages 253-259
Cirrhosis Is Associated With Worse Outcomes in Ischemic Colitis: A Nationwide Retrospective Study
Figure
Tables
| IC + cirrhosis (N = 420) | IC with no cirrhosis (N = 28,615) | P value | |
|---|---|---|---|
| IC: ischemic colitis; PI: Pacific Islander. | |||
| Age (years) | 63.9 | 70.4 | 0.0001 |
| Gender | |||
| Male | 210 (50%) | 7,469 (26.1%) | - |
| Female | 210 (50%) | 21,146 (73.9%) | 0.0001 |
| Race | |||
| White | 283 (67.5%) | 23,436 (81.9%) | 0.0001 |
| Black | 46 (10.9%) | 2,175 (7.6%) | 0.013 |
| Hispanic | 76 (18%) | 1,745 (6.1%) | 0.0001 |
| Asian/PI | 0 (0%) | 687 (2.4%) | 0.002 |
| Native American | 5 (1.2%) | 86 (0.3%) | 0.005 |
| Other | 10 (2.4%) | 486 (1.7%) | 0.3778 |
| Hospital region | |||
| Northeast | 60 (14.2%) | 6,066 (21.2%) | 0.0007 |
| Midwest | 130 (31%) | 7,383 (25.8%) | 0.0194 |
| South | 155 (37%) | 9,987 (34.9%) | 0.4217 |
| West | 75 (17.8%) | 5,179 (18.1%) | 0.949 |
| Hospital bed size | |||
| Small | 50 (11.9%) | 6,066 (21.2%) | 0.0001 |
| Medium | 160 (38.1%) | 9,157 (32%) | 0.0092 |
| Large | 210 (50%) | 13,392 (46.8%) | 0.2094 |
| Insurance | |||
| Medicare | 205 (48.8%) | 20,317 (71%) | 0.0001 |
| Medicaid | 95 (22.6%) | 1,774 (6.2%) | 0.0001 |
| Private insurance | 95 (22.6%) | 5,580 (19.5%) | 0.124 |
| Self-pay | 10 (2.4%) | 458 (1.6%) | 0.2866 |
| No charge | 0 (0%) | 28 (0.1%) | 0.5213 |
| Other | 15 (3.6%) | 458 (1.6%) | 0.0029 |
| IC + cirrhosis (N = 420) | IC with no cirrhosis (N = 28,615) | P value | |
|---|---|---|---|
| IC: ischemic colitis; LOS: length of hospital stay; USD: United States Dollar; IC: ischemic colitis. | |||
| LOS (days) | 7.3 | 4.8 | 0.0001 |
| Total charge (USD) | $84,769 | $48,347 | 0.0002 |
| Died | 45 (10.7%) | 1,045 (3.6%) | 0.0001 |
| Colectomy | 10 (2.3%) | 1,465 (5.1%) | 0.0153 |
| Odds ratio | 95% CI | P value | |
|---|---|---|---|
| A-fib: atrial fibrillation; CAD: coronary artery disease; CHF: congestive heart failure; CI: confidence interval; DM: diabetes mellitus; ESRD: end-stage renal disease; HTN: hypertension; PVD: peripheral vascular disease; PI: Pacific Islander. | |||
| Cirrhosis | 0.31 | 0.07 - 1.27 | 0.104 |
| A-fib | 1.95 | 1.43 - 2.64 | 0.000 |
| CAD | 1.05 | 0.77 - 1.42 | 0.738 |
| CHF | 1.22 | 0.82 - 1.82 | 0.305 |
| PVD | 1.11 | 0.71 - 1.73 | 0.633 |
| ESRD | 1.50 | 0.93 - 2.42 | 0.095 |
| HTN | 0.84 | 0.63 - 1.11 | 0.224 |
| DM | 1.12 | 0.84 - 1.49 | 0.423 |
| Age | 0.98 | 0.97 - 0.99 | 0.005 |
| Gender | |||
| Male (reference) | - | - | - |
| Female | 0.56 | 0.43 - 0.72 | 0.000 |
| Race | |||
| White (reference) | - | - | - |
| Black | 1.68 | 1.11 - 2.53 | 0.013 |
| Hispanic | 1.09 | 0.66 - 1.78 | 0.726 |
| Asian/PI | 1.13 | 0.51 - 2.49 | 0.758 |
| Native American | 6.24 | 1.83 - 21.30 | 0.003 |
| Other | 1.21 | 0.50 - 2.93 | 0.667 |
| Odds ratio | 95% CI | P value | |
|---|---|---|---|
| A-fib: atrial fibrillation; CAD: coronary artery disease; CHF: congestive heart failure; CI: confidence interval; DM: diabetes mellitus; ESRD: end-stage renal disease; HTN: hypertension; PVD: peripheral vascular disease; PI: Pacific Islander. | |||
| Cirrhosis | 3.15 | 1.46 - 6.79 | 0.003 |
| A-fib | 2.31 | 1.68 - 3.16 | 0.000 |
| CAD | 0.87 | 0.62 - 1.22 | 0.430 |
| CHF | 1.30 | 0.88 - 1.92 | 0.187 |
| PVD | 1.69 | 1.05 - 2.73 | 0.030 |
| ESRD | 3.29 | 1.93 - 5.62 | 0.000 |
| HTN | 0.59 | 0.42 - 0.83 | 0.002 |
| DM | 0.75 | 0.53 - 1.05 | 0.096 |
| Age | 1.03 | 1.02 - 1.05 | |
| Gender | |||
| Male (reference) | - | - | - |
| Female | 0.72 | 0.53 - 0.99 | 0.046 |
| Race | |||
| White (reference) | - | - | - |
| Black | 1.30 | 0.75 - 2.24 | 0.347 |
| Hispanic | 1.14 | 0.64 - 2.04 | 0.643 |
| Asian/PI | 0.87 | 0.31 - 2.38 | 0.791 |
| Native American | 1.97 | 0.28 - 13.66 | 0.492 |
| Other | 2.05 | 0.85 - 4.95 | 0.109 |