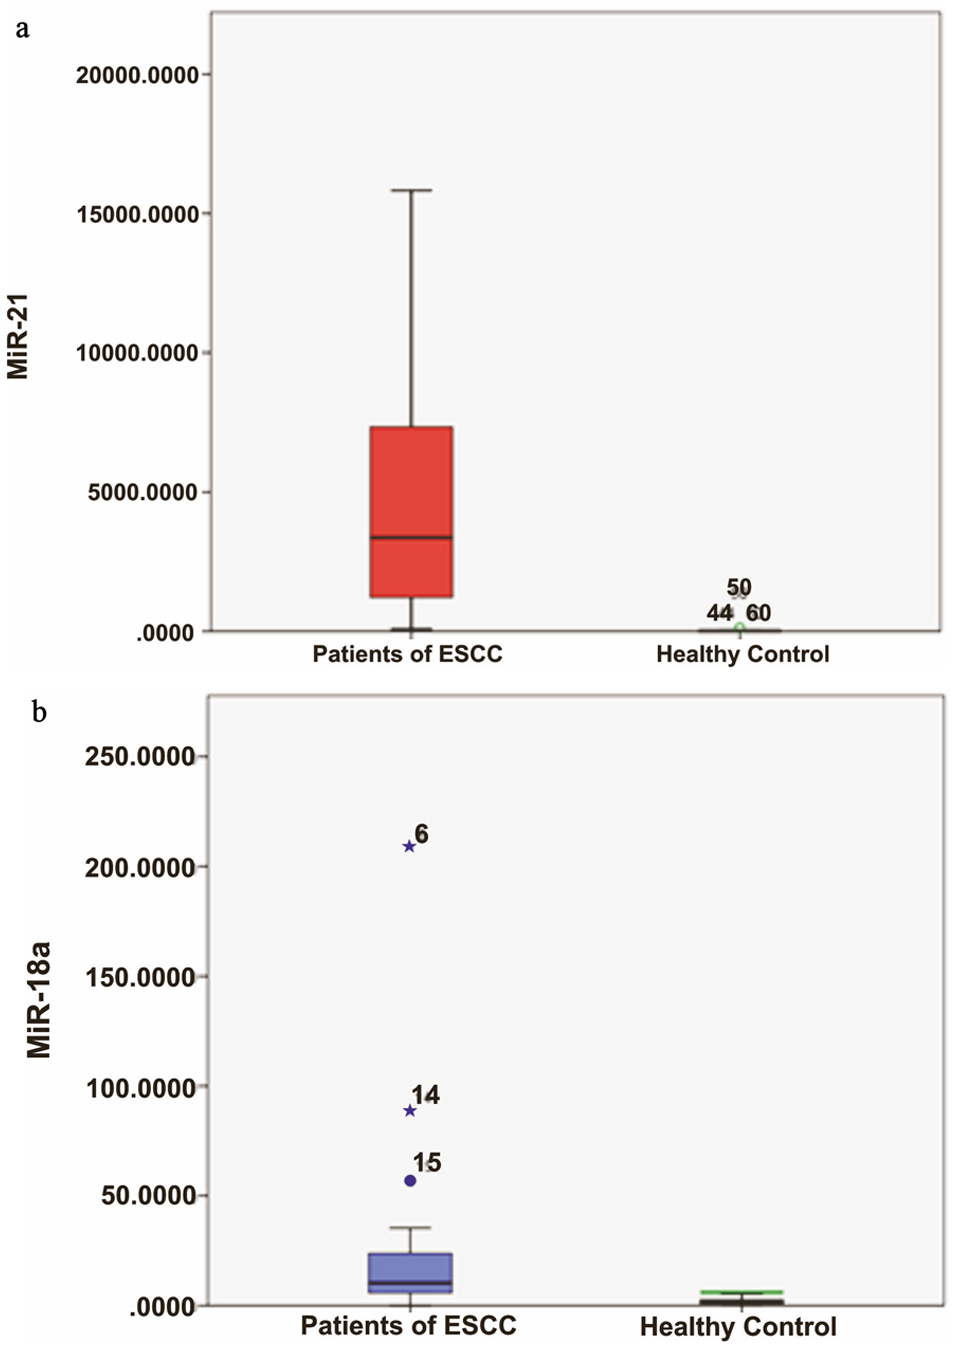
Figure 1. (a) Relative quantification (RQ) of miRNA-21 in ESCC patients (P) and controls (C). (b) RQ of miRNA-18a in ESCC P and C. ESCC: esophageal squamous cell carcinoma.
| Gastroenterology Research, ISSN 1918-2805 print, 1918-2813 online, Open Access |
| Article copyright, the authors; Journal compilation copyright, Gastroenterol Res and Elmer Press Inc |
| Journal website http://www.gastrores.org |
Original Article
Volume 13, Number 3, June 2020, pages 107-113
Evaluation of Roles of MicroRNA-21 and MicroRNA-18a in Esophageal Squamous Cell Carcinoma and Comparison of Their Changes in Expression Post-Chemoradiotherapy
Figures
Tables
| Variable | Patients (n = 30) | MiRNA-21 mean expression (RQ) ± SD | P valuea | MiRNA-18a mean expression (RQ) ± SD | P valueb |
|---|---|---|---|---|---|
| aP value of miRNA-21; bP value of miRNA-18a. MiRNA: microRNA; RQ: relative quantification; SD: standard deviation. | |||||
| Age | |||||
| < 60 years | 20 | 65.31 ± 64.81 | 0.948 | 165.01 ± 289.59 | 0.746 |
| ≥ 60 years | 10 | 53.60 ± 33.45 | 72.52 ± 39.27 | ||
| Sex | |||||
| Male | 19 | 16.75 ± 17.34 | 0.445 | 30.28 ± 37.39 | 0.832 |
| Female | 11 | 19.50 ± 14.58 | 50.19 ± 101.31 | ||
| Risk factors | |||||
| Smoking | |||||
| Yes | 13 (43.33%) | 58.66 ± 61.219 | 0.68 | 37.61 ± 42.09 | 0.245 |
| No | 17 (56.66%) | 63.51 ± 53.41 | 37.55 ± 82.65 | ||
| Tobacco chewing | |||||
| Yes | 15 (50%) | 14.82 ± 13.55 | 0.461 | 23.73 ± 35.83 | 0.267 |
| No | 15 (50%) | 20.69 ± 18.44 | 51.43 ± 87.36 | ||
| Alcohol | |||||
| Yes | 7 | 21.35 ± 19.65 | 0.564 | 7.38 ± 6.62 | 0.61 |
| No | 23 | 14.66 ± 13.11 | 4.15 ± 9.31 | ||
| Variable | Patients (n = 30) | MiRNA-21 mean expression (RQ) ± SD | P valuea, b | MiRNA-18a mean expression (RQ) ± SD | P valuea, c |
|---|---|---|---|---|---|
| aP values are from χ2 or Fisher’s exact probability test and were considered significant as 0.05. bP value of miRNA-21. cP value of miRNA-18a. dClinical classification. eTNM classification. MiRNA: microRNA; RQ: relative quantification; SD: standard deviation. | |||||
| Dysphagia | |||||
| Grade 4 | 0 | - | 0.054 | - | 0.649 |
| Grade 3 | 16 | 18.44 ± 13.03 | 34.31 ± 38.56 | ||
| Grade 2 | 11 | 21.04 ± 20.43 | 19.21 ± 17.46 | ||
| Grade 1 | 3 | 2.05 ± 1.25 | 122.38 ± 199.71 | ||
| Tumor invasion | |||||
| cT1d | 5 | 990.93 ± 999.92 | 0.004 | 52.24 ± 88.27 | 0.743 |
| cT2d | 6 | 3,266.39 ± 5,282.25 | 16.52 ± 21.56 | ||
| cT3d | 15 | 5,738.60 ± 3,525.74 | 18.29 ± 21.63 | ||
| cT4d | 4 | 10,438.12 ± 5,129.27 | 8.29 ± 2.41 | ||
| Lymph node metastasis | |||||
| Absent | 10 | 3,655.72 ± 5,938.40 | 0.011 | 29.57 ± 63.63 | 0.502 |
| Present | 20 | 5,791.36 ± 3,793.10 | 18.59 ± 21.20 | ||
| Distant metastasis | |||||
| Absent | 26 | 4,315.09 ± 4,005.00 | 0.038 | 23.16 ± 42.28 | 0.617 |
| Present | 4 | 10,048.01 ± 5,950.24 | 16.34 ± 12.92 | ||
| Stagee | |||||
| I, II | 10 | 2,247.64 ± 4,184.69 | 0.001 | 35.45 ± 63.40 | 0.846 |
| III, IV | 20 | 6,495.40 ± 4,250.43 | 15.63 ± 19.18 | ||
| Histology grading | |||||
| Well-differentiated | 12 | 14.25 ± 13.02 | 0.439 | 44.62 ± 98.04 | 0.549 |
| Moderately differentiated | 18 | 20.09 ± 17.95 | 32.89 ± 37.46 | ||
| Poorly differentiated | 0 | - | - | ||
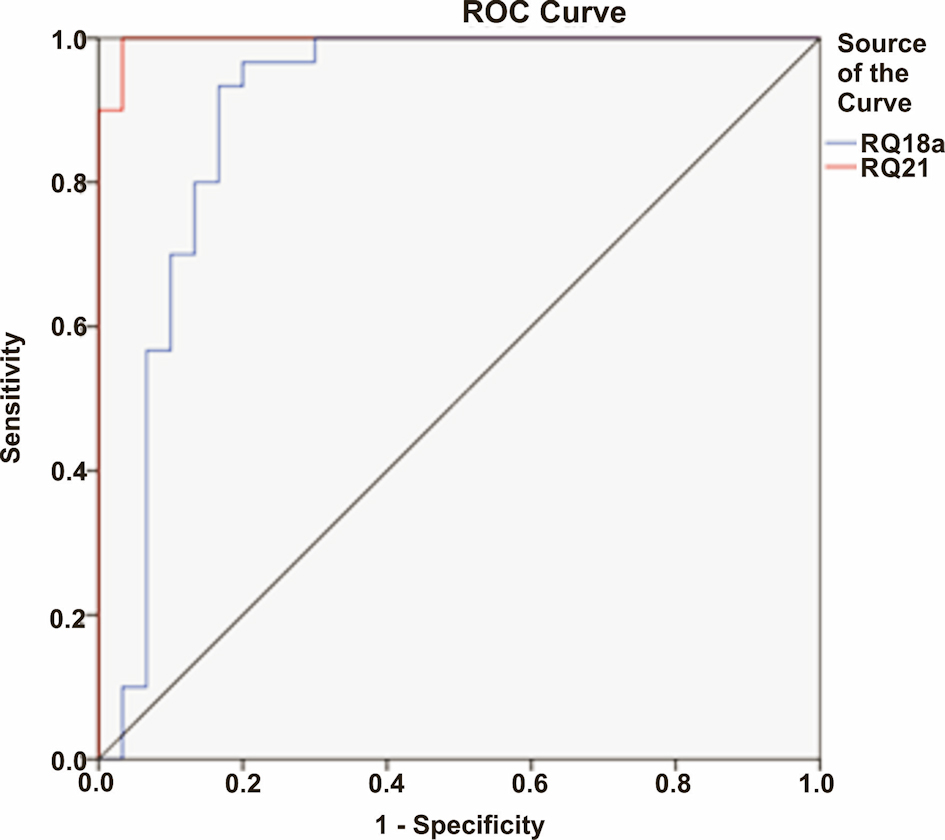
| Variable | Area | SEa | Asymptotic significanceb | 95% CI | |
|---|---|---|---|---|---|
| Lower bound | Upper bound | ||||
| aUnder the nonparametric assumption. bNull hypothesis: true area = 0.5. AUC: area under the curve; ROC: receiver operating characteristic; SE: standard error; CI: confidence interval. | |||||
| MiRNA-18a | 0.900 | 0.047 | 0.001 | 0.809 | 0.991 |
| MiRNA-21 | 0.997 | 0.004 | 0.001 | 0.989 | 1.000 |