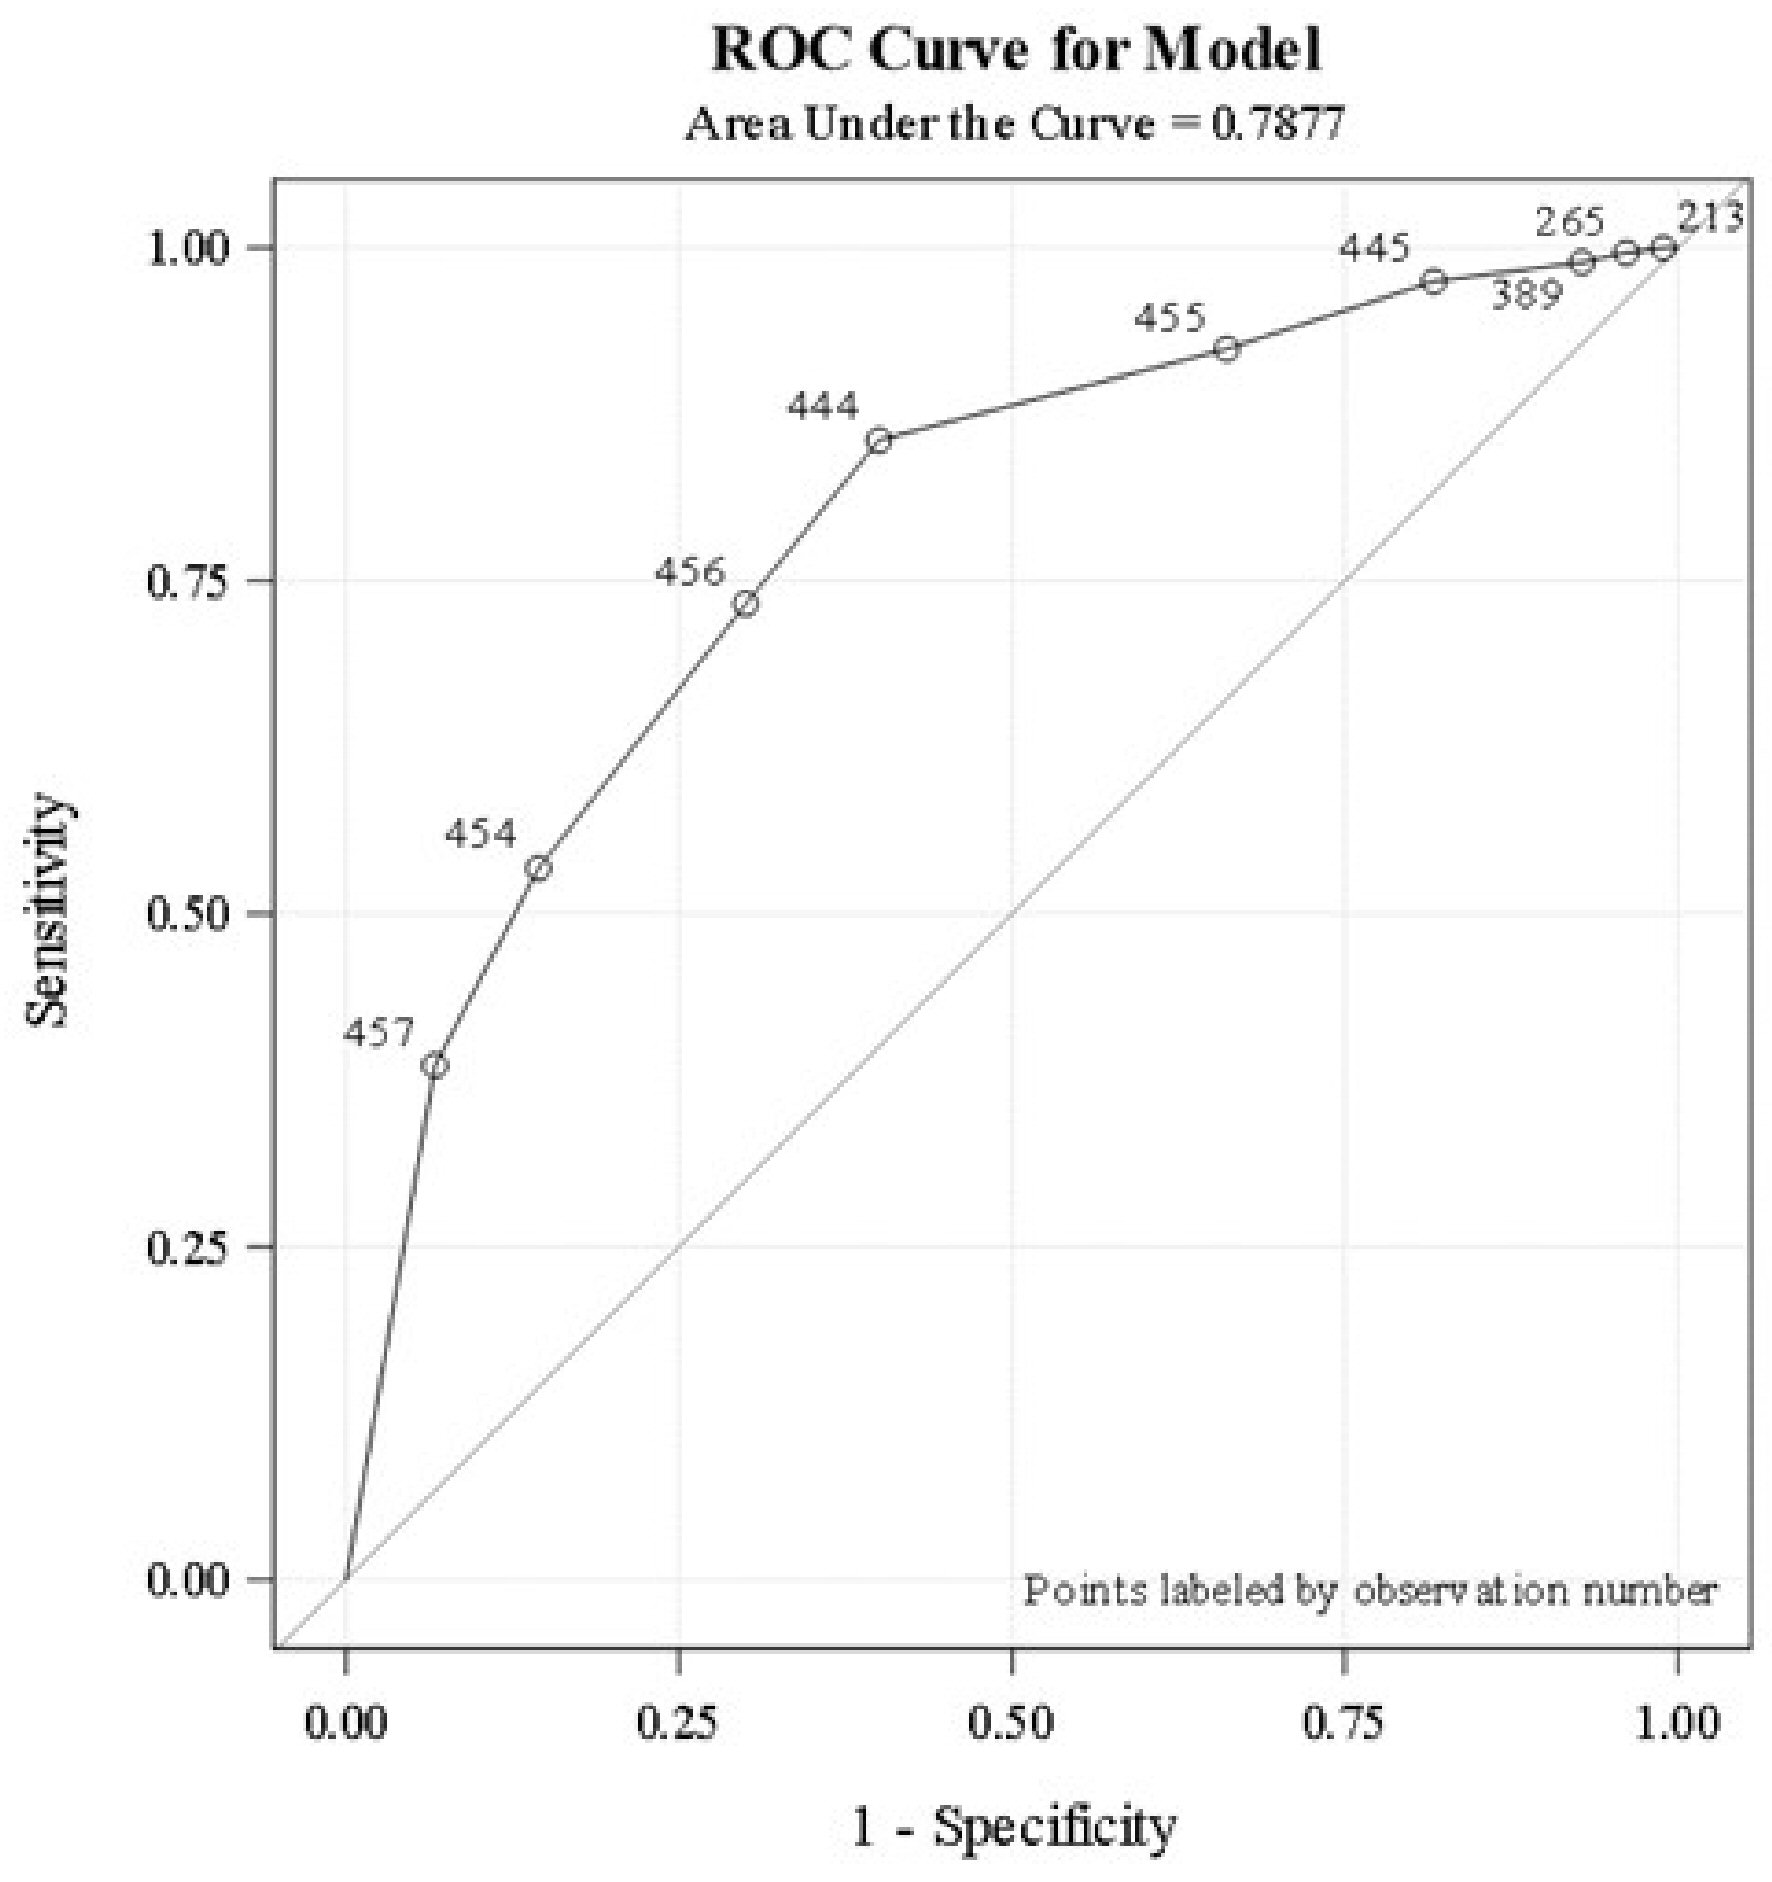
Figure 1. Logistic regression analysis demonstrates the association between the proportion of basic infectious workup tests completed and infection status. Analysis is based on the area under the ROC curve. ROC: receiver operating characteristic.
| Gastroenterology Research, ISSN 1918-2805 print, 1918-2813 online, Open Access |
| Article copyright, the authors; Journal compilation copyright, Gastroenterol Res and Elmer Press Inc |
| Journal website https://www.gastrores.org |
Original Article
Volume 13, Number 5, October 2020, pages 199-207
Fungal Infection in Acutely Decompensated Cirrhosis Patients: Value of Model for End-Stage Liver Disease Score
Figure
Tables
| Variable | Infection frequency (%)/mean ± SD | OR (95% CI) | C-statistics | P value |
|---|---|---|---|---|
| Y/N: yes/no; SD: standard deviation; C-statistic: concordance statistic; OR: odds ratio; CI: confidence interval; SIRS: systemic inflammatory response syndrome; DM: diabetes mellitus; CKD: chronic kidney diseases; HD: hemodialysis; TIPS: transjugular intrahepatic portosystemic shunt; Fib-4: fibrosure-4; APRI: AST to platelet ration index; CTP: Child-Turcotte-Pugh; MELD: model for end-stage liver disease; WBC: white blood cell count; Hb: hemoglobin; PT: prothrombin; INR: international normalized ratio; PTT: prothrombin time; TB: total bilirubin; DB: direct bilirubin; ALB: albumin; ALP: alkaline phosphatase test; AST: aspartate aminotransferase; ALT: alanine transaminase; Cr: creatinine. | ||||
| SIRS criteria, Y/N (n = 455) | 159 (84.13)/116 (43.61) | 6.85 (4.33, 10.85) | 0.71 | < 0.0001 |
| Sex, male/female | 164 (55.78)/113 (69.33) | 0.56 (0.37, 0.84) | 0.57 | < 0.01 |
| DM, Y/N (n = 455) | 103 (68.67)/173 (56.72) | 1.67 (1.11, 2.53) | 0.56 | 0.01 |
| CKD, Y/N (n = 456) | 36 (66.67)/240 (59.70) | 1.35 (0.74, 2.46) | 0.52 | 0.33 |
| HD, Y/N | 21 (87.50)/256 (59.12) | 4.84 (1.42, 16.45) | 0.53 | 0.01 |
| Chemotherapy, Y/N (n = 449) | 2 (28.57)/269 (60.86) | 0.26 (0.05, 1.34) | 0.51 | 0.11 |
| Immunotherapy, Y/N (n = 454) | 20 (55.56)/256 (61.24) | 0.79 (0.40, 1.57) | 0.51 | 0.50 |
| History of Clostridium difficile, Y/N | 13 (76.47)/264 (60.00) | 2.17 (0.70, 6.75) | 0.51 | 0.18 |
| History of cocci, Y/N | 7 (50.00)/270 (60.95) | 0.64 (0.22, 1.86) | 0.51 | 0.41 |
| TIPS, Y/N | 28 (65.12)/249 (60.14) | 1.24 (0.64, 2.39) | 0.51 | 0.53 |
| Ever smoker, Y/N (n = 453) | 137 (58.05)/137 (63.13) | 0.81 (0.55, 1.18) | 0.53 | 0.27 |
| Ever drinker, Y/N (n = 442) | 164 (56.55)/103 (67.76) | 0.62 (0.41, 0.94) | 0.55 | 0.02 |
| Antibiotic, Y/N (n = 441) | 38 (76.00)/229 (58.57) | 2.24 (1.14, 4.42) | 0.54 | 0.02 |
| Supplements, Y/N (n = 456) | 36 (61.02)/240 (60.45) | 1.02 (0.59, 1.79) | 0.50 | 0.93 |
| Lactate (n = 314) | 3.29 ± 2.77 | 1.19 (1.05, 1.34) | 0.58 | < 0.01 |
| Platelet | 117.28 ± 78.21 | 0.999 (0.997, 1.002) | 0.53 | 0.58 |
| Fib-4 | 12.09 ± 26.13 | 1.003 (0.995, 1.011) | 0.51 | 0.48 |
| APRI | 5.11 ± 17.57 | 1.01 (0.99, 1.02) | 0.48 | 0.38 |
| CTP | 11.48 ± 1.46 | 1.10 (0.96, 1.25) | 0.54 | 0.16 |
| MELD (n = 428) | 18.73 ± 8.52 | 1.04 (1.02, 1.07) | 0.60 | < 0.01 |
| Age (n = 456) | 55.50 ± 10.87 | 1.03 (1.02, 1.05) | 0.60 | < 0.001 |
| WBC (n = 456) | 9.08 ± 6.03 | 1.08 (1.04, 1.12) | 0.58 | < 0.0001 |
| Hb | 11.16 ± 2.78 | 0.99 (0.92, 1.06) | 0.51 | 0.74 |
| PT (n = 433) | 21.42 ± 17.95 | 1.00 (0.99, 1.01) | 0.56 | 0.67 |
| INR (n= 433) | 1.69 ± 0.96 | 1.25 (0.98, 1.61) | 0.57 | 0.08 |
| PTT (n = 231) | 38.57 ± 16.80 | 1.03 (1.00, 1.06) | 0.58 | < 0.05 |
| TB (n = 453) | 5.00 ± 6.32 | 0.99 (0.97, 1.02) | 0.49 | 0.69 |
| DB (n = 106) | 5.70 ± 5.51 | 0.99 (0.92, 1.06) | 0.45 | 0.73 |
| ALB (n = 402) | 3.43 ± 12.04 | 1.01 (0.98, 1.05) | 0.42 | 0.45 |
| ALP (n = 455) | 163.77 ± 128.99 | 0.999 (0.997, 1.000) | 0.51 | 0.18 |
| AST | 115.86 ± 248.31 | 1.00 (0.999, 1.001) | 0.47 | 0.54 |
| ALT | 64.95 ± 155.36 | 1.00 (0.999, 1.001) | 0.46 | 0.77 |
| Cr (n = 454) | 1.54 ± 1.88 | 1.19 (1.03, 1.38) | 0.60 | 0.02 |
| Variable | Infection frequency (%)/mean ± SD | OR (95% CI) | C-statistics | P value |
|---|---|---|---|---|
| Y/N: yes/no; SD: standard deviation; C-statistic: concordance statistic; OR: odds ratio; CI: confidence interval; SIRS: systemic inflammatory response syndrome; DM: diabetes mellitus; CKD: chronic kidney diseases; HD: hemodialysis; TIPS: transjugular intrahepatic portosystemic shunt; Fib-4: fibrosure-4; APRI: AST to platelet ration index; CTP: Child-Turcotte-Pugh; MELD: model for end-stage liver disease; WBC: white blood cell count; Hb: hemoglobin; PT: prothrombin; INR: international normalized ratio; PTT: prothrombin time; TB: total bilirubin; DB: direct bilirubin; ALB: albumin; ALP: alkaline phosphatase test; AST: aspartate aminotransferase; ALT: alanine transaminase; Cr: creatinine. | ||||
| SIRS criteria, Y/N (n = 455) | 114 (60.32)/92 (34.59) | 2.88 (1.96, 4.23) | 0.63 | < 0.0001 |
| Sex, male/female | 120 (40.82)/86 (52.76) | 0.62 (0.42, 0.91) | 0.56 | 0.01 |
| DM, Y/N (n = 455) | 70 (46.67)/135 (44.26) | 1.10 (0.74, 1.63) | 0.51 | 0.63 |
| CKD, Y/N (n = 456) | 28 (51.85)/177 (44.03) | 1.37 (0.78, 2.42) | 0.52 | 0.28 |
| HD, Y/N | 15 (62.50)/191 (44.11) | 2.11 (0.90, 4.93) | 0.52 | 0.08 |
| Chemotherapy, Y/N (n = 449) | 1 (14.29)/200 (45.25) | 0.20 (0.02, 1.69) | 0.51 | 0.14 |
| Immunotherapy, Y/N (n = 454) | 12 (33.33)/194 (46.41) | 0.58 (0.28, 1.19) | 0.52 | 0.13 |
| History of Clostridium difficile, Y/N | 7 (41.18)/199 (45.23) | 0.85 (0.32, 2.27) | 0.50 | 0.74 |
| History of cocci, Y/N | 5 (35.71)/201 (45.37) | 0.67 (0.22, 2.03) | 0.51 | 0.48 |
| TIPS, Y/N | 25 (58.14)/181 (43.72) | 1.79 (0.95, 3.38) | 0.53 | 0.07 |
| Ever smoker, Y/N (n = 453) | 94 (39.83)/109 (50.23) | 0.66 (0.45, 0.95) | 0.55 | 0.03 |
| Ever drinker, Y/N (n = 442) | 121 (41.72)/77 (50.66) | 0.70 (0.47, 1.04) | 0.54 | 0.07 |
| Antibiotic, Y/N (n = 441) | 28 (56.00)/172 (43.99) | 1.62 (0.90, 2.93) | 0.52 | 0.11 |
| Supplements, Y/N (n = 456) | 27 (45.76)/179 (45.09) | 1.03 (0.59, 1.78) | 0.50 | 0.92 |
| Lactate (n = 314) | 3.29 ± 2.77 | 1.11 (1.01, 1.21) | 0.58 | 0.02 |
| Platelet | 117.28 ± 78.21 | 1.001 (0.999, 1.004) | 0.52 | 0.23 |
| Fib-4 | 12.09 ± 26.13 | 1.003 (0.996, 1.010) | 0.47 | 0.40 |
| APRI | 5.11 ± 17.57 | 1.01 (0.99, 1.02) | 0.45 | 0.28 |
| CTP | 11.48 ± 1.46 | 1.16 (1.02, 1.32) | 0.57 | 0.02 |
| MELD (n = 428) | 18.73 ± 8.52 | 1.02 (1.00, 1.05) | 0.56 | 0.05 |
| Age (n = 456) | 55.50 ± 10.87 | 1.03 (1.01, 1.05) | 0.59 | < 0.01 |
| WBC (n = 456) | 9.08 ± 6.03 | 1.06 (1.03, 1.10) | 0.58 | < 0.001 |
| Hb | 11.16 ± 2.78 | 0.98 (0.92, 1.05) | 0.51 | 0.58 |
| PT (n = 433) | 21.42 ± 17.95 | 1.01 (0.99, 1.02) | 0.55 | 0.35 |
| INR (n = 433) | 1.69 ± 0.96 | 1.20 (0.97, 1.49) | 0.55 | 0.09 |
| PTT (n = 231) | 38.57 ± 16.80 | 1.01 (0.99, 1.03) | 0.57 | 0.28 |
| TB (n = 453) | 5.00 ± 6.32 | 0.98 (0.95, 1.01) | 0.52 | 0.27 |
| DB (n = 106) | 5.70 ± 5.51 | 1.00 (0.93, 1.07) | 0.51 | 0.95 |
| ALB (n = 402) | 3.43 ± 12.04 | 1.00 (0.98, 1.01) | 0.53 | 0.73 |
| ALP (n = 455) | 163.77 ± 128.99 | 0.999 (0.997, 1.000) | 0.54 | 0.13 |
| AST | 115.86 ± 248.31 | 1.000 (0.999, 1.001) | 0.47 | 0.84 |
| ALT | 64.95 ± 155.36 | 1.000 (0.998, 1.001) | 0.57 | 0.62 |
| Cr (n = 454) | 1.54 ± 1.88 | 1.10 (0.98, 1.22) | 0.59 | 0.09 |
| Variable | Infection frequency (%)/mean ± SD | OR (95% CI) | C-statistics | P value |
|---|---|---|---|---|
| Y/N: yes/no; SD: standard deviation; C-statistic: concordance statistic; OR: odds ratio; CI: confidence interval; SIRS: systemic inflammatory response syndrome; DM: diabetes mellitus; CKD: chronic kidney diseases; HD: hemodialysis; TIPS: transjugular intrahepatic portosystemic shunt; Fib-4: fibrosure-4; APRI: AST to platelet ration index; CTP: Child-Turcotte-Pugh; MELD: model for end-stage liver disease; WBC: white blood cell count; Hb: hemoglobin; PT: prothrombin; INR: international normalized ratio; PTT: prothrombin time; TB: total bilirubin; DB: direct bilirubin; ALB: albumin; ALP: alkaline phosphatase test; AST: aspartate aminotransferase; ALT: alanine transaminase; Cr: creatinine. | ||||
| SIRS criteria, Y/N (n = 455) | 12 (6.35)/13 (4.89) | 1.32 (0.59, 2.96) | 0.53 | 0.50 |
| Sex, male/female | 13 (4.42)/12 (7.36) | 0.58 (0.26, 1.31) | 0.57 | 0.19 |
| DM, Y/N (n = 455) | 11 (7.33)/14 (4.59) | 1.65 (0.73, 3.72) | 0.56 | 0.23 |
| CKD, Y/N (n = 456) | 4 (7.41)/21 (5.22) | 1.45 (0.48, 4.40) | 0.52 | 0.51 |
| HD, Y/N | 1 (4.17)/24 (5.54) | 0.74 (0.10, 5.72) | 0.51 | 0.77 |
| Chemotherapy, Y/N (n = 449) | 1 (14.29)/24 (5.43) | 2.90 (0.34, 25.09) | 0.51 | 0.33 |
| Immunotherapy, Y/N (n = 454) | 3 (8.33)/22 (5.26) | 1.64 (0.47, 5.75) | 0.52 | 0.44 |
| History of Clostridium difficile, Y/N | 0 (0)/25 (5.68) | NA | 0.52 | 0.98 |
| History of cocci, Y/N | 0 (0)/25 (5.64) | NA | 0.52 | 0.98 |
| TIPS, Y/N | 1 (2.33)/24 (5.80) | 0.39 (0.05, 2.93) | 0.53 | 0.36 |
| Ever smoker, Y/N (n = 453) | 13 (5.51)/12 (5.53) | 1.00 (0.44, 2.23) | 0.50 | 0.99 |
| Ever drinker, Y/N (n = 442) | 15 (5.17)/9 (5.92) | 0.87 (0.37, 2.03) | 0.52 | 0.74 |
| Antibiotic, Y/N (n = 441) | 5 (10.00)/20 (5.12) | 2.06 (0.74, 5.76) | 0.55 | 0.17 |
| Supplements, Y/N (n = 456) | 2 (3.39)/23 (5.79) | 0.57 (0.13, 2.49) | 0.53 | 0.45 |
| Lactate (n = 314) | 3.29 ± 2.77 | 1.10 (0.98, 1.25) | 0.62 | 0.11 |
| Platelet | 117.28 ± 78.21 | 0.996 (0.990, 1.002) | 0.55 | 0.21 |
| Fib-4 | 12.09 ± 26.13 | 1.00 (0.99, 1.02) | 0.57 | 0.76 |
| APRI | 5.11 ± 17.57 | 0.99 (0.95, 1.03) | 0.45 | 0.67 |
| CTP | 11.48 ± 1.46 | 1.20 (0.91, 1.60) | 0.55 | 0.20 |
| MELD (n = 428) | 18.73 ± 8.52 | 1.06 (1.01, 1.10) | 0.69 | 0.01 |
| Age (n = 456) | 55.50 ± 10.87 | 1.01 (0.98, 1.05) | 0.53 | 0.53 |
| WBC (n = 456) | 9.08 ± 6.03 | 0.96 (0.89, 1.04) | 0.51 | 0.35 |
| Hb | 11.16 ± 2.78 | 0.84 (0.72, 0.97) | 0.64 | 0.02 |
| PT (n = 433) | 21.42 ± 17.95 | 1.013 (1.001, 1.026) | 0.70 | 0.03 |
| INR (n = 433) | 1.69 ± 0.96 | 1.34 (1.03, 1.74) | 0.71 | 0.03 |
| PTT (n = 231) | 38.57 ± 16.80 | 1.015 (0.996, 1.034) | 0.73 | 0.13 |
| TB (n = 453) | 5.00 ± 6.32 | 1.052 (1.004, 1.102) | 0.63 | 0.03 |
| DB (n = 106) | 5.70 ± 5.51 | 0.91 (0.76, 1.10) | 0.52 | 0.35 |
| ALB (n = 402) | 3.43 ± 12.04 | 1.013 (0.996, 1.031) | 0.41 | 0.13 |
| ALP (n = 455) | 163.77 ± 128.99 | 0.999 (0.995, 1.003) | 0.53 | 0.59 |
| AST | 115.86 ± 248.31 | 0.996 (0.990, 1.003) | 0.52 | 0.27 |
| ALT | 64.95 ± 155.36 | 0.99 (0.98, 1.01) | 0.56 | 0.18 |
| Cr (n = 454) | 1.54 ± 1.88 | 1.01 (0.82, 1.25) | 0.51 | 0.89 |
| Variable | Best cutoffa | Sensitivityb | Specificityb | Youdenc |
|---|---|---|---|---|
| aThe value maximizes Youden statistic. bROC analysis was performed to derive sensitivity and specificity based on a logistic regression model with the continuous variable of interest (e.g., MELD) as the only covariate. cYouden = sensitivity + specificity - 1. MELD: model for end-stage liver disease; ROC: receiver operating characteristic. | ||||
| MELD | 19.33 | 81.8% | 58.6% | 40.4% |
| Total bilirubin | 4.20 | 64.0% | 67.8% | 31.8% |
| International normalized ratio | 1.50 | 79.2% | 54.8% | 33.9% |
| Hemoglobin | 11.30 | 76.0% | 49.8% | 25.8% |