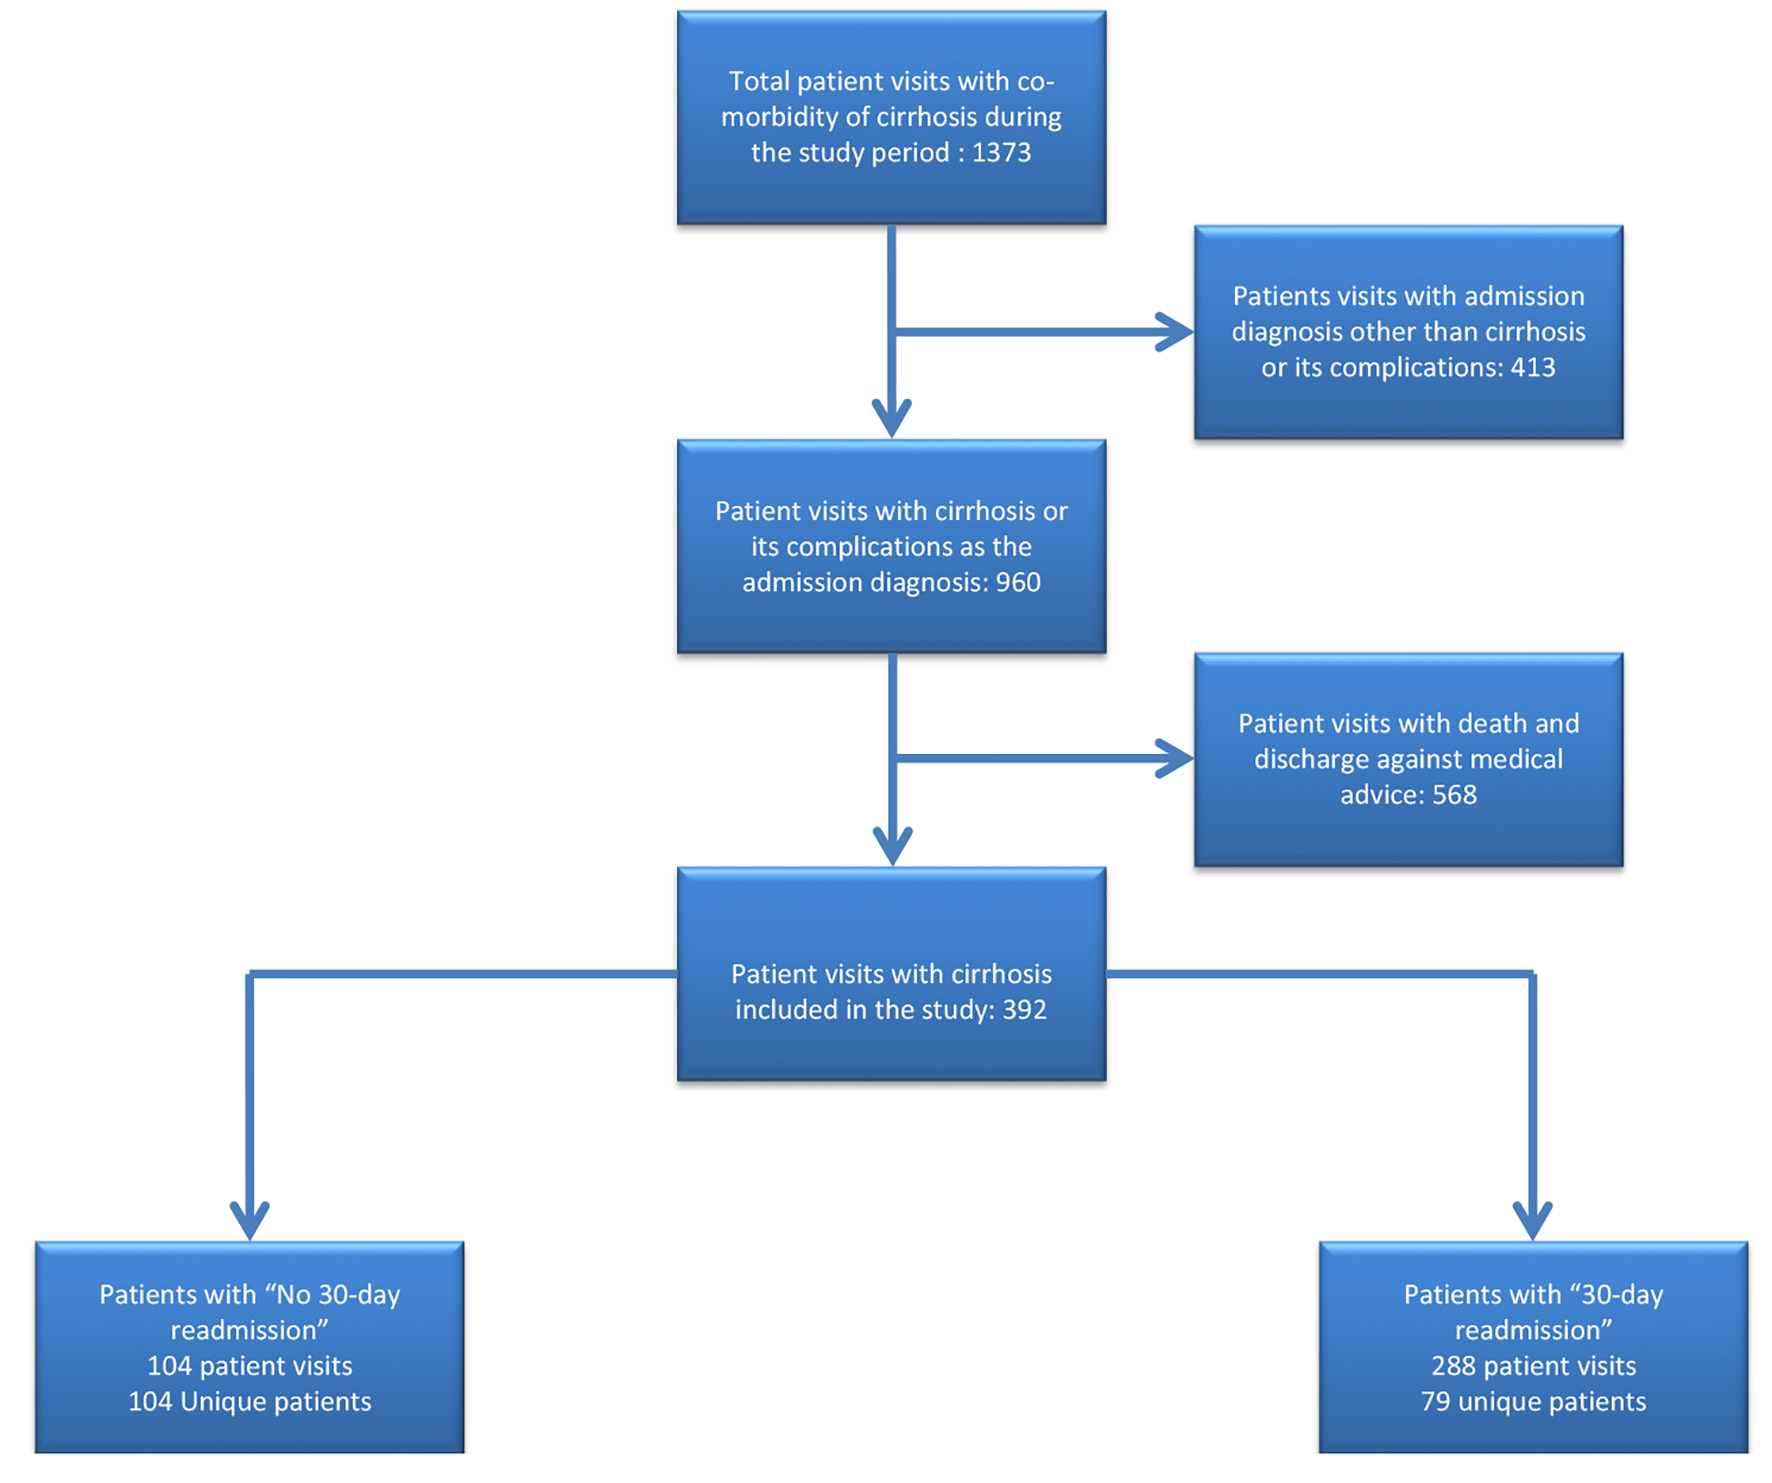
Figure 1. Flowchart of patients included in the study.
| Gastroenterology Research, ISSN 1918-2805 print, 1918-2813 online, Open Access |
| Article copyright, the authors; Journal compilation copyright, Gastroenterol Res and Elmer Press Inc |
| Journal website http://www.gastrores.org |
Original Article
Volume 13, Number 1, February 2020, pages 11-18
Risk Factors for Liver Cirrhosis-Related Readmissions in the Largest Ethnic Minority in United States
Figure
Tables
| Variables | Patients with no readmission (n = 104) | Patients with readmission (n = 79) | P-value |
|---|---|---|---|
| CKD: chronic kidney disease; COPD: chronic obstructive pulmonary disease; CHF: congestive heart failure; CAD: coronary artery disease; WBC: white blood cell count; ALT: alanine aminotransferase; PT: prothrombin time. | |||
| Age (years), N (%) | 58.3 (+9.8) | 59.8 (+12.5) | 0.640 |
| Gender, N (%) | |||
| Female | 40 (38.46%) | 29 (36.71%) | |
| Male | 64 (61.54%) | 50 (63.29%) | |
| Race, N (%) | 0.818 | ||
| African American | 25 (24.04%) | 17 (21.52%) | |
| Hispanic | 60 (57.69%) | 43 (54.43%) | |
| Others | 17 (16.35%) | 17 (21.52%) | |
| White Caucasian | 2 (1.92%) | 2 (2.53%) | |
| Co-morbid conditions, N (%) | |||
| Hepatitis C | 66 (63.46%) | 50 (63.29%) | 0.981 |
| Hepatitis B | 1 (0.96%) | 5 (6.33%) | 0.040 |
| Hypertension | 64 (61.54%) | 51 (64.56%) | 0.676 |
| CKD | 12 (11.54%) | 14 (17.72%) | 0.235 |
| Diabetes mellitus | 40 (38.46%) | 27 (34.18%) | 0.551 |
| COPD | 6 (5.77%) | 5 (6.33%) | 0.875 |
| CHF | 9 (8.65%) | 4 (5.06%) | 0.349 |
| CAD | 9 (8.65%) | 5 (6.33%) | 0.558 |
| Atrial fibrillation | 7 (6.73%) | 2 (2.53%) | 0.193 |
| Psychiatric condition | 25 (24.04%) | 15 (18.99%) | 0.413 |
| HIV | 13 (12.50%) | 13 (16.46%) | 0.477 |
| Malignancy | 8 (7.69%) | 8 (10.13%) | 0.564 |
| Laboratory parameters | |||
| Hemoglobin (g/dL) | 10.76 (+2.06) | 10.60 (+1.83) | 0.582 |
| WBC (103/µL) | 6.63 (+3.82) | 5.70 (+3.34) | 0.082 |
| Neutrophil (%) | 62.55 (+14.22) | 61.20 (+13.9) | 0.519 |
| Platelet count (103/µL) | 123.68 (+101.46) | 89.34 (+45.14) | 0.003 |
| Sodium (mEq/L) | 136.65 (+4.36) | 136.24 (+4.71) | 0.607 |
| Potassium (mEq/L) | 4.12 (+0.67) | 4.02 (+0.54) | 0.263 |
| Creatinine (mg/dL) | 1.38 (+1.67) | 1.31 (+1.73) | 0.760 |
| ALT (Unit/L) | 109.54 (+388.32) | 55.49 (+63.19) | 0.166 |
| Albumin (mg/dL) | 2.83 (+0.78) | 2.72 (+0.71) | 0.099 |
| Total bilirubin (mg/dL) | 2.82 (+4.45) | 3.36 (+4.28) | 0.411 |
| PT (s) | 16.21 (+10.66) | 16 (+4.23) | 0.859 |
| Patients with no readmission (n = 104) | Patients with readmission (n = 79) | P-value | |
|---|---|---|---|
| MELD: model for end-stage liver disease; Na: sodium. | |||
| MELD score | 15 ± 8 | 16 ± 6 | 0.250 |
| MELD-Na score | 17 ± 7 | 19 ± 6 | 0.180 |
| Child-Pugh class (CPT) | 0.013 | ||
| CPT class A, N (%) | 6 (13.33%) | 0 (0.00%) | |
| CPT class B, N (%) | 23 (51.11%) | 29 (50.88%) | |
| CPT class C, N (%) | 16 (35.56%) | 28 (49.12%) | |
| Alcohol use within 1 month of admission, N (%) | 34 (32.69%) | 44 (55%) | 0.002 |
| Alcohol use between 1 and 6 months prior to admission, N (%) | 32 (30.7%) | 33 (41%) | 0.123 |
| Patients with no readmission (n = 104) | Patients with readmission (n = 79) | P-value | |
|---|---|---|---|
| Reason for index admission | 0.693 | ||
| Ascites, N (%) | 44 (42.31%) | 36 (45.57%) | |
| Hepatic encephalopathy, N (%) | 40 (38.46%) | 28 (35.44) | |
| Variceal bleeding, N (%) | 11 (10.58%) | 11(13.92) | |
| Hepatocellular carcinoma, N (%) | 9 (8.65%) | 4 (5.06%) | |
| Medical insurance | 0.629 | ||
| Medicare, N (%) | 17 (16.3%) | 13 (16.5%) | |
| Medicaid, N (%) | 38 (36.5%) | 34 (43%) | |
| Commercial insurance, N (%) | 49 (47.1 %) | 32 (40.5%) | |
| Discharge disposition | |||
| Discharge to home with services, N (%) | 28 (26.92%) | 24 (30.38%) | 0.680 |
| Discharge to home with no services, N (%) | 1 (0.96%) | 3 (3.80%) | 0.194 |
| Discharge to nursing home, N (%) | 20 (19.23%) | 25 (31.65%) | 0.050 |
| Discharge on weekend, N (%) | 35 (33.65%) | 24 (30.38%) | 0.630 |
| Number of medications at the time of discharge | 5.2 (+3.5) | 7.3 (+3.9) | 0.005 |
| Reason for hospitalization | Index hospitalization for patients with readmission | Subsequent hospitalization for patients with readmission | P-value |
|---|---|---|---|
| Ascites, N (%) | 36 (45.5%) | 94 (44.97%) | 0.337 |
| Hepatocellular carcinoma, N (%) | 4 (5.06%) | 9 (4.3%) | |
| Hepatic encephalopathy, N (%) | 28 (35.44%) | 90 (43.06%) | |
| Variceal bleeding, N (%) | 11 (13.92%) | 16 (7.65%) |
| Patients with no readmission (n = 104) | Patient with readmission (n = 79) | P-value | |
|---|---|---|---|
| 7 days clinic follow-up, N (%) | 13 (12.50%) | 11 (13.92%) | 0.777 |
| 8 - 14 days clinic follow-up, N (%) | 11 (10.58%) | 8 (10.13%) | 0.921 |
| 15 - 30 day clinic follow-up, N (%) | 18 (17.31%) | 16 (20.25%) | 0.612 |
| Primary care follow-up, N (%) | 23 (22.12%) | 17 (21.52%) | 0.923 |
| Gastroenterology follow-up, N (%) | 12 (11.54%) | 13 (16.46%) | 0.337 |
| 90-day mortality, N (%) | 13 (12.50%) | 11 (13.92%) | 0.777 |
| Study group | Unique patients | Number of hospitalizations during the study period | Cumulative number of hospital visits |
|---|---|---|---|
| aPatients at the highest risk for readmission who had four or more hospital visits during the study period. | |||
| No readmission | 104 | 1 | 104 |
| Readmission | 38 | 2 | 76 |
| 12 | 3 | 36 | |
| 11a | 4 | 44 | |
| 7a | 5 | 35 | |
| 4a | 6 | 24 | |
| 2a | 7 | 14 | |
| 3a | 8 | 24 | |
| 1a | 16 | 16 | |
| 1a | 19 | 19 | |
| Total number of patients with readmission | 79 | 212 | |
| Total number of patients at highest risk for readmission | 29 (31%) | 176 (61%) | |
| Variables | P-value |
|---|---|
| Alcohol use within 1 month of admission | 0.016 |
| Discharge to a nursing home | 0.531 |
| Number of medications at the time of discharge | 0.039 |
| Platelet count | 0.049 |