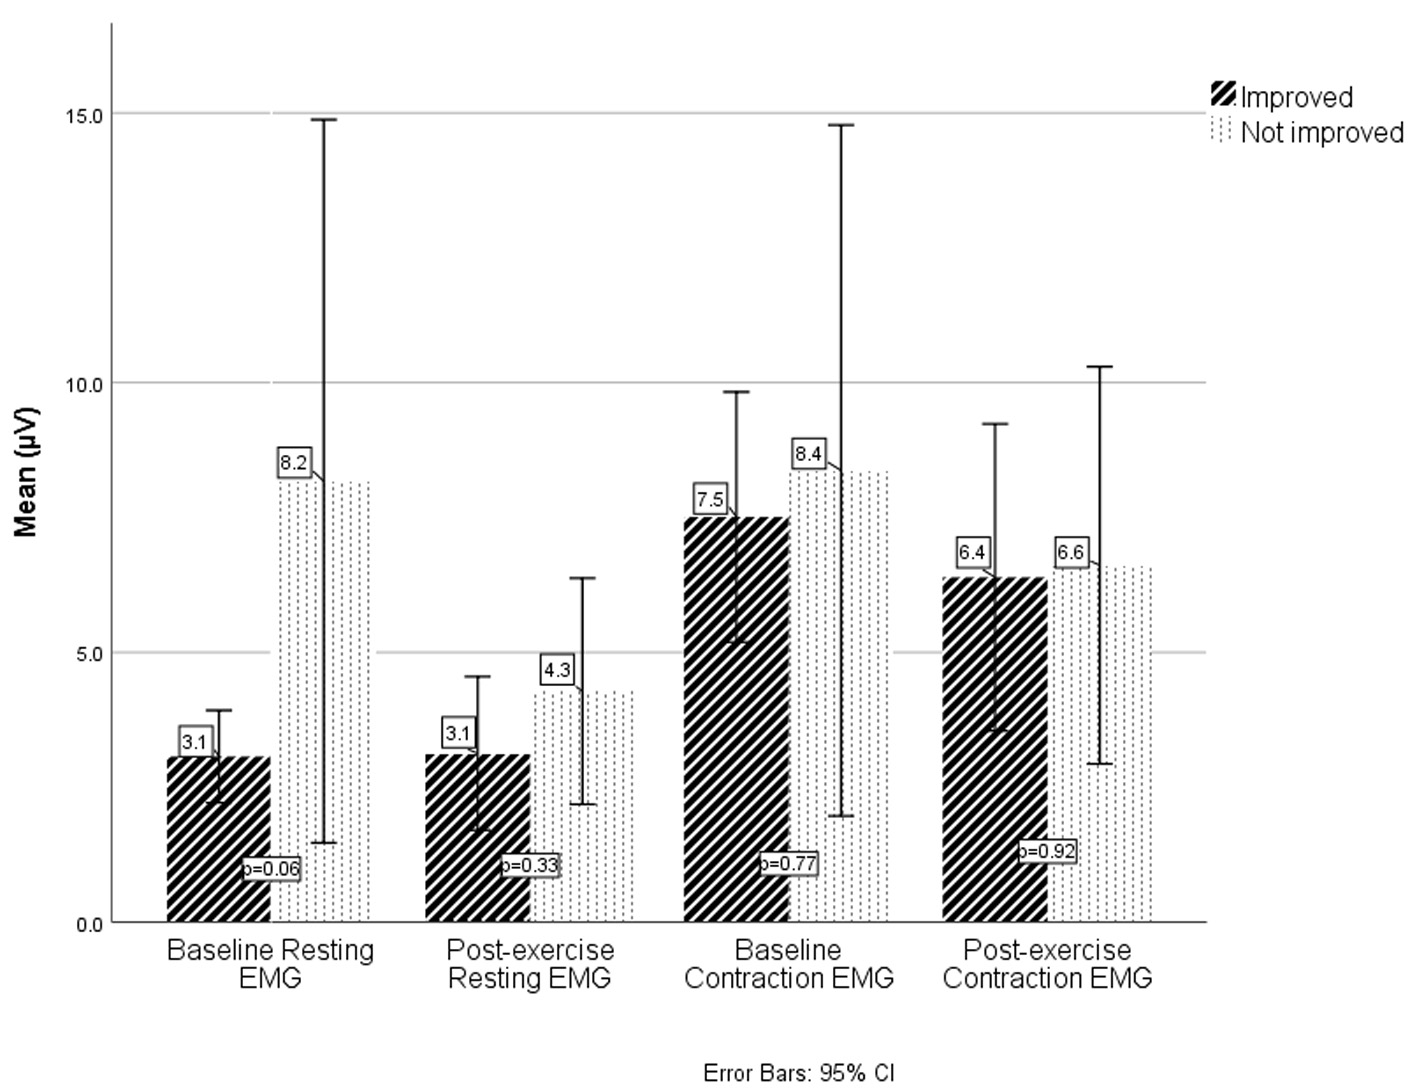
Figure 1. EMG values at baseline and after exercises in improved and not-improved respondents. EMG values are measured in microVolts (µV). EMG: electromyography.
| Gastroenterology Research, ISSN 1918-2805 print, 1918-2813 online, Open Access |
| Article copyright, the authors; Journal compilation copyright, Gastroenterol Res and Elmer Press Inc |
| Journal website http://www.gastrores.org |
Original Article
Volume 12, Number 5, October 2019, pages 252-255
Can Baseline Electromyography Predict Response to Biofeedback for Anorectal Disorder? A Long-Term Follow-Up Study
Figure
Table
| Characteristics | Improved, n = 25 | Not improved, n = 16 | P value |
|---|---|---|---|
| EMG: electromyography. | |||
| Age (years) | 49.08 ± 15.7 | 48.75 ± 15.6 | 0.95 |
| Gender | 0.38 | ||
| Male | 5/6 (83%) | 1/6 (17%) | |
| Female | 20/35 (57%) | 15/35 (43%) | |
| Indication | 0.71 | ||
| Constipation | 15/27 (56%) | 12/27 (44%) | |
| Fecal incontinence | 6/9 (67%) | 3/9 (33%) | |
| Other | 4/5 (80%) | 1/5 (20%) | |
| Baseline EMG (µV) | |||
| Resting | 3.11 ± 1.85 | 7.41 ± 11.01 | 0.06 |
| Contraction | 7.08 ± 5.03 | 7.79 ± 10.47 | 0.77 |