Figures
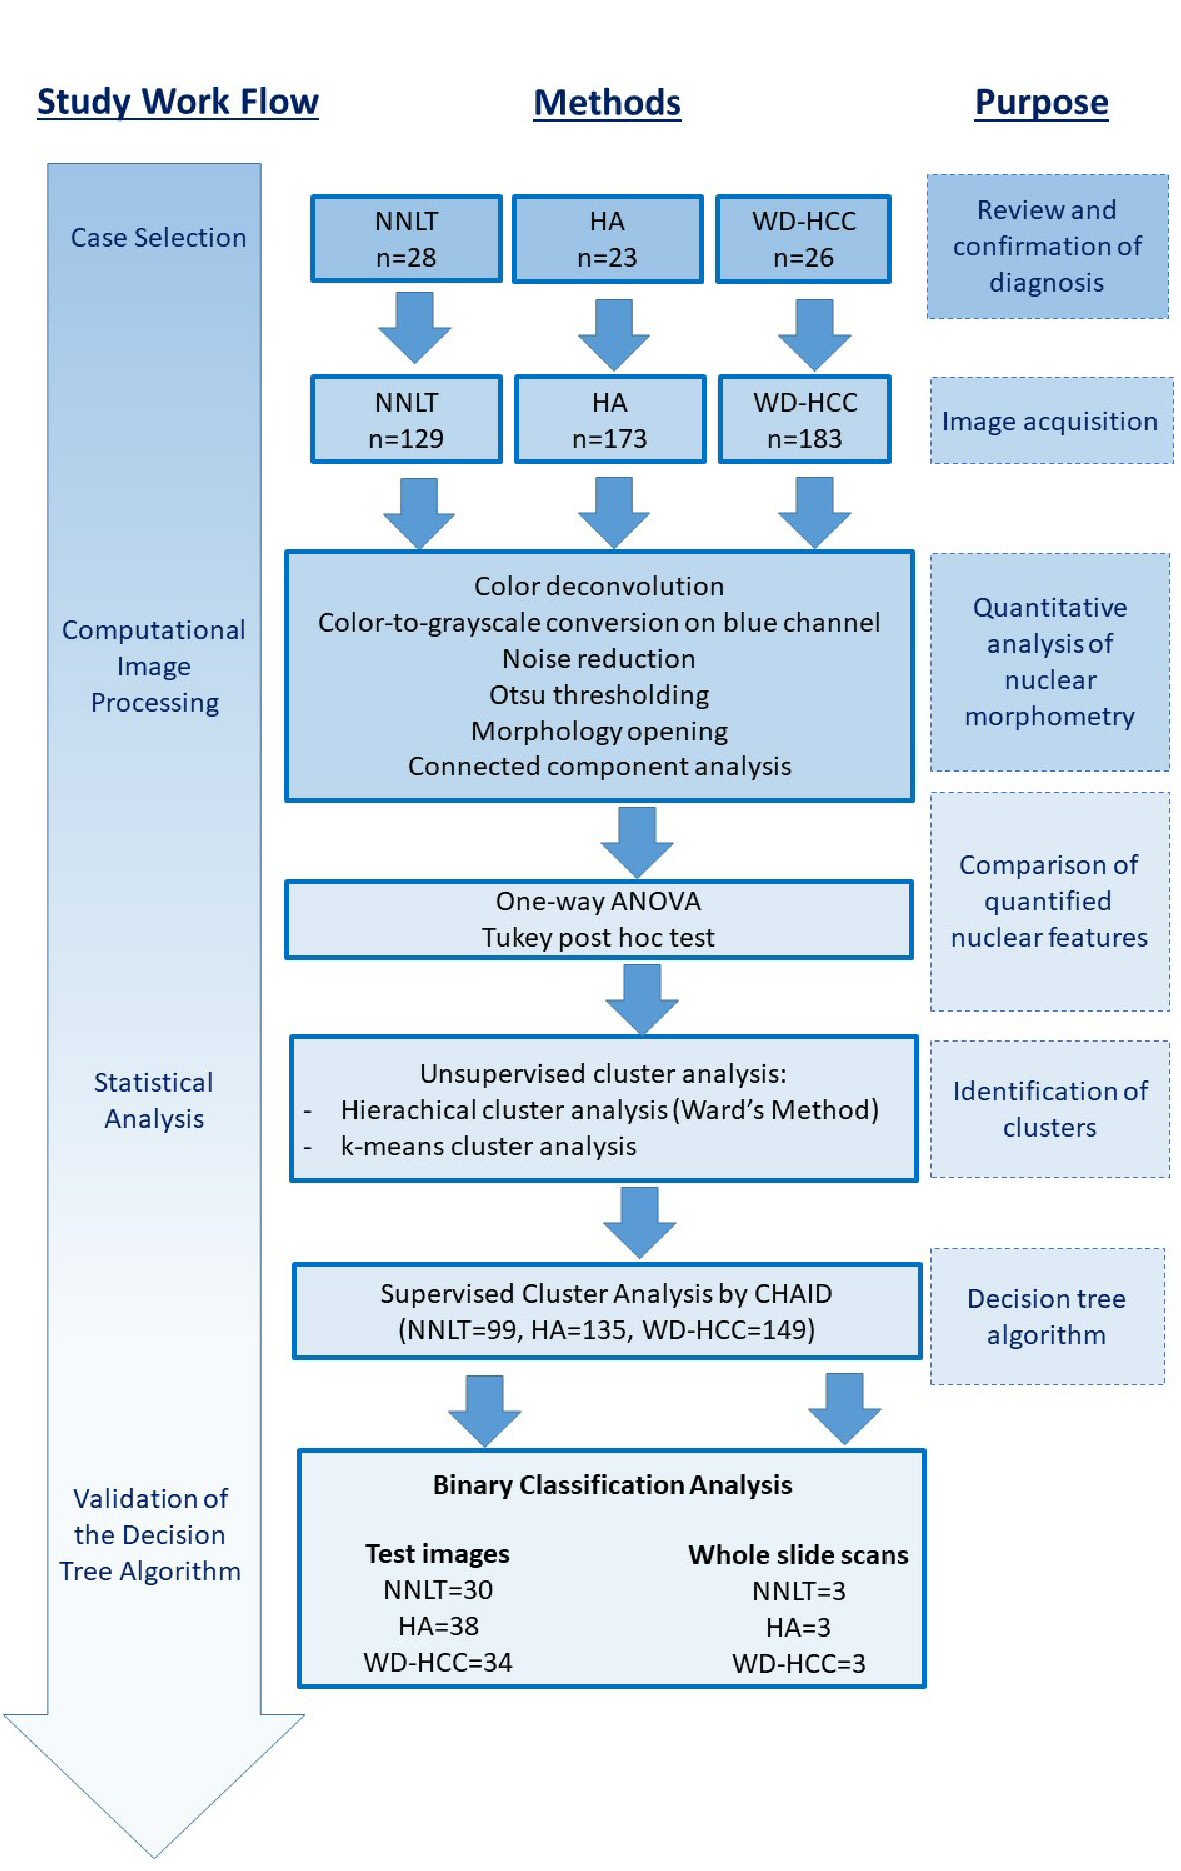
Figure 1. Illustration of work flow and methods for research.
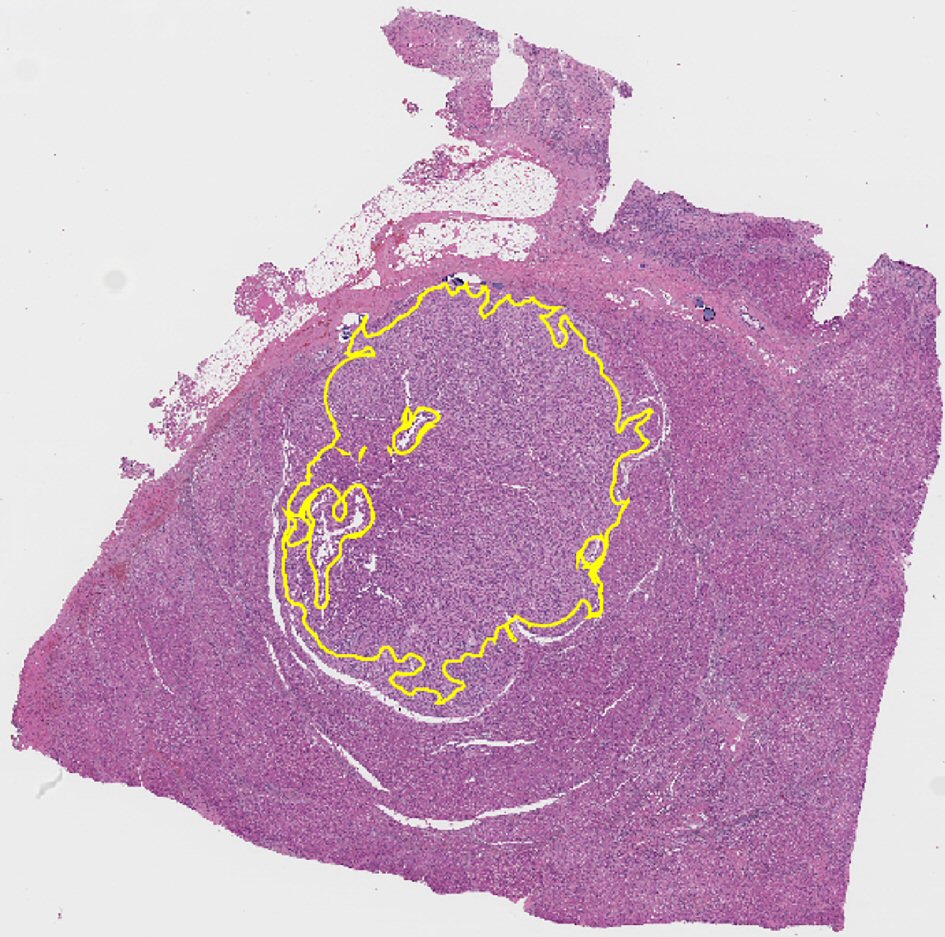
Figure 2. Representative whole slide scan of resected liver tissue showing region of interest selected for analysis demarcated in yellow. Note that it excludes portal tracts.
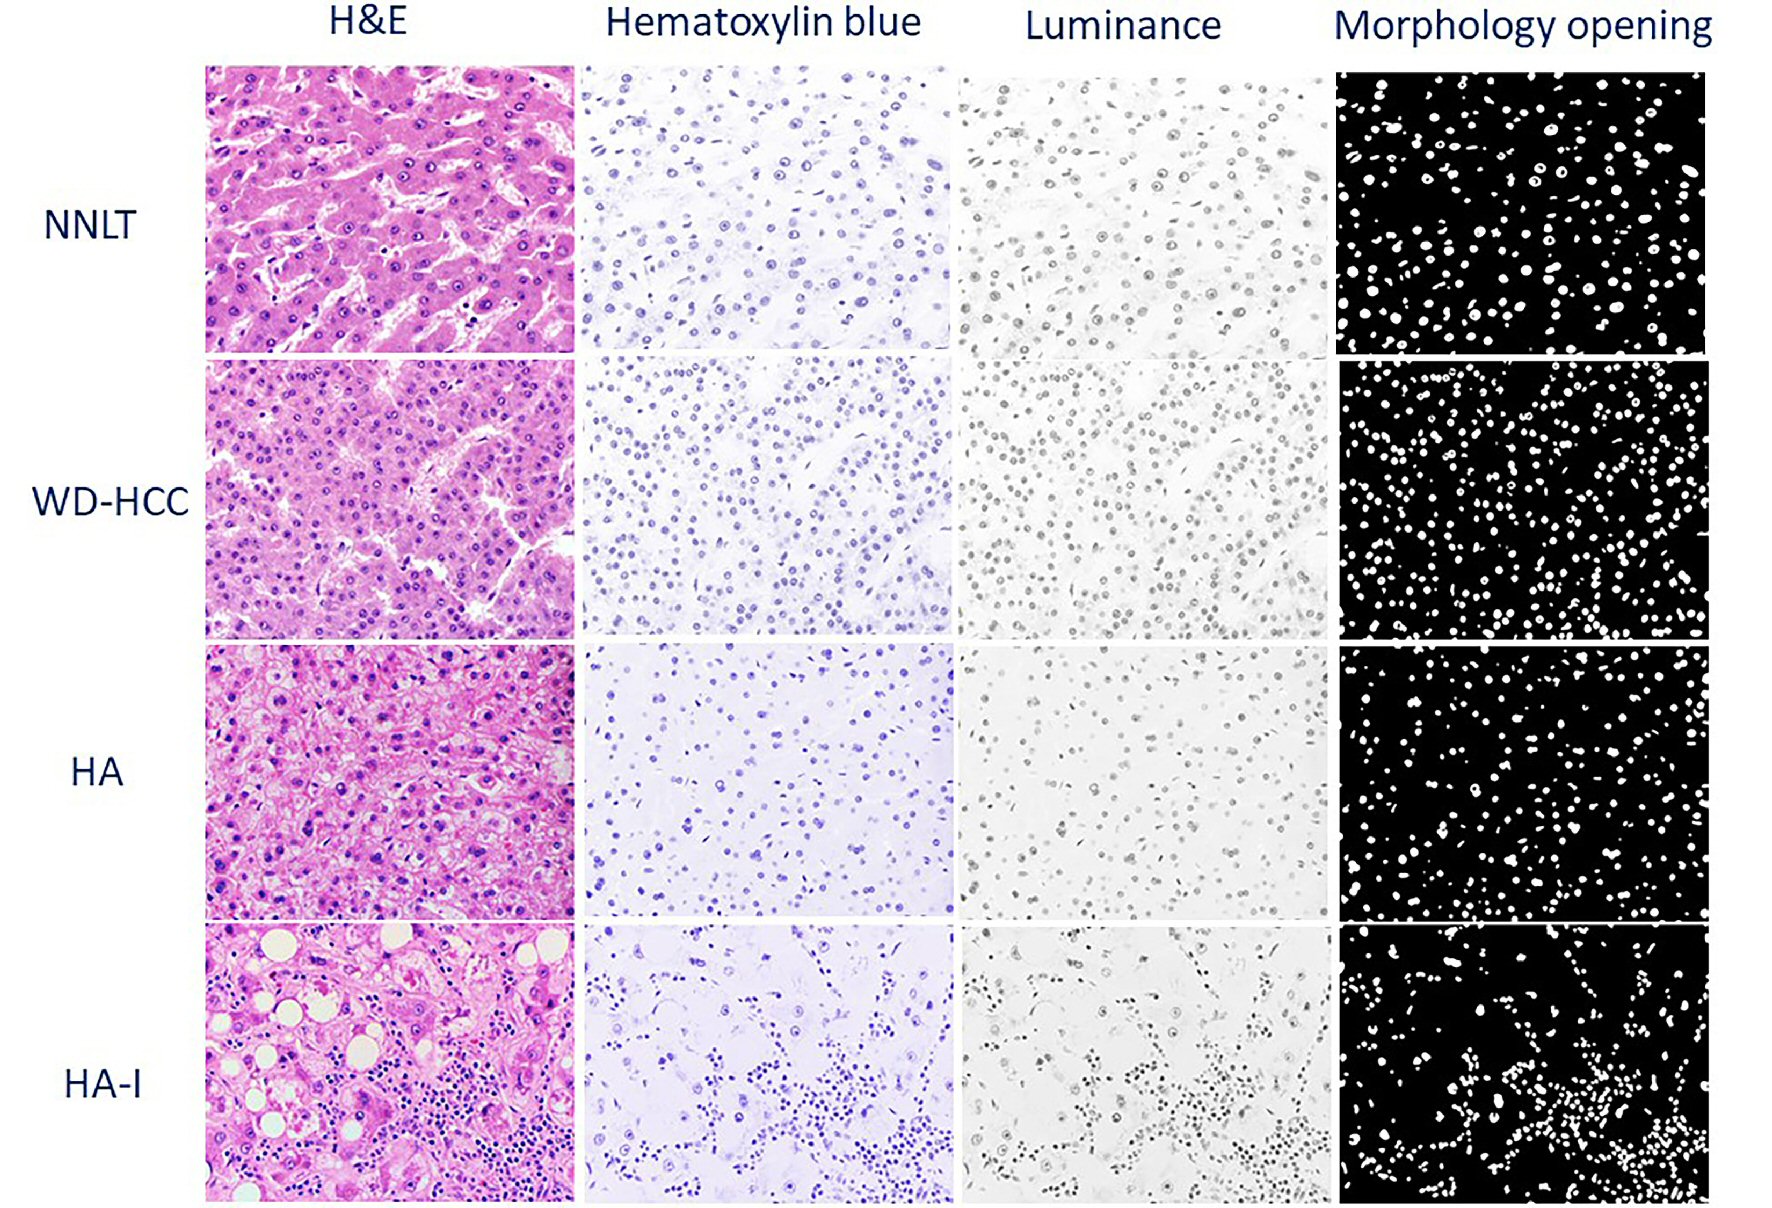
Figure 3. Representative photomicrographs of non-neoplastic liver tissue (NNLT), hepatocellular adenoma (HA), inflammatory type hepatocellular adenoma (HA-I), and well-differentiated hepatocellular carcinoma (WD-HCC) in sequential order: hematoxylin and eosin (H&E), and digitally transformed to hematoxylin blue, luminance, and morphological opening (× 400).
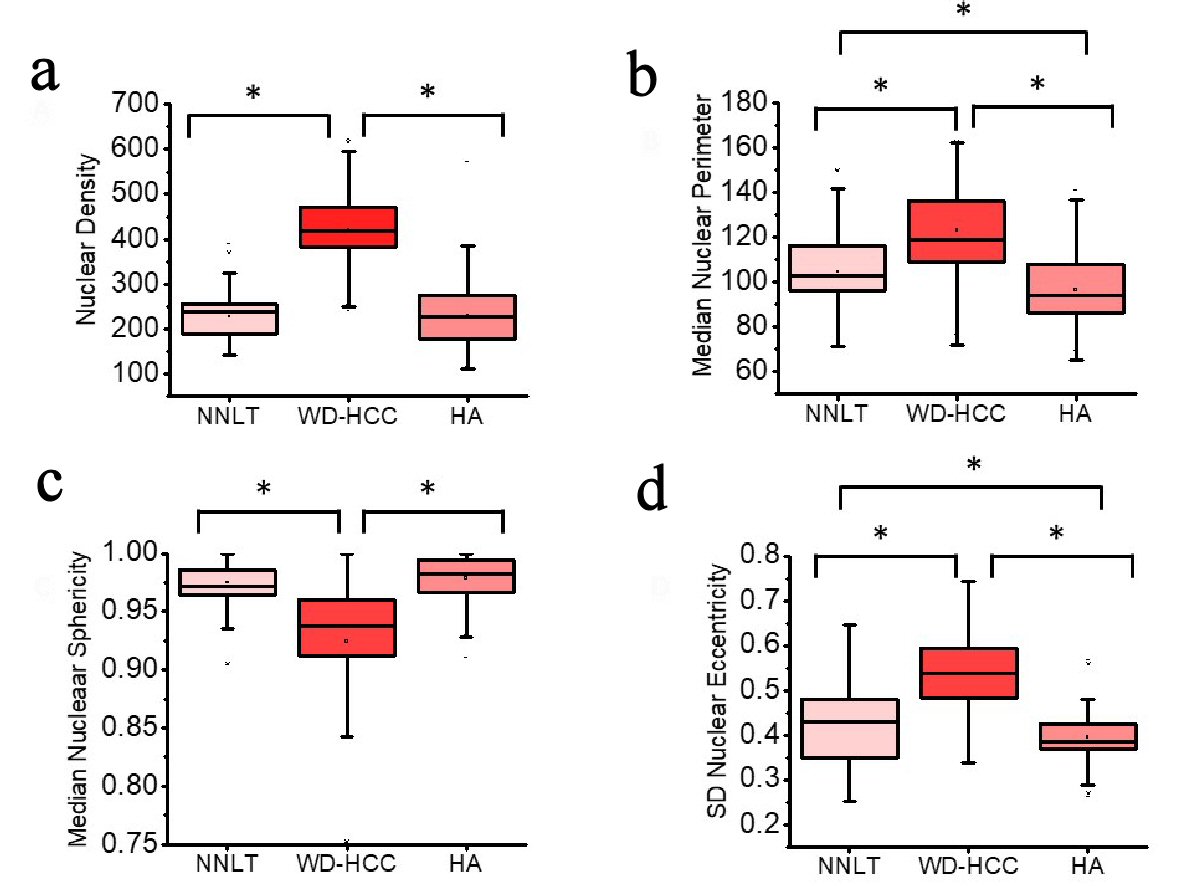
Figure 4. Distribution of nuclear density (a), median nuclear perimeter (b), median nuclear sphericity (c), and standard deviation (SD) nuclear eccentricity (d) of non-neoplastic liver tissue (NNLT) (n = 129), well-differentiated hepatocellular carcinoma (WD-HCC) (n = 183), and hepatocellular adenoma (HA) (n = 173) (P < 0.001; one-way analysis of variance (ANOVA)). Bars indicate 5th and 95th percentiles; boxes represent the 25th and 75th percentiles; lines inside the boxes are medians. Asterisks (*) indicate significant (P < 0.05) differences by Tukey post hoc test.
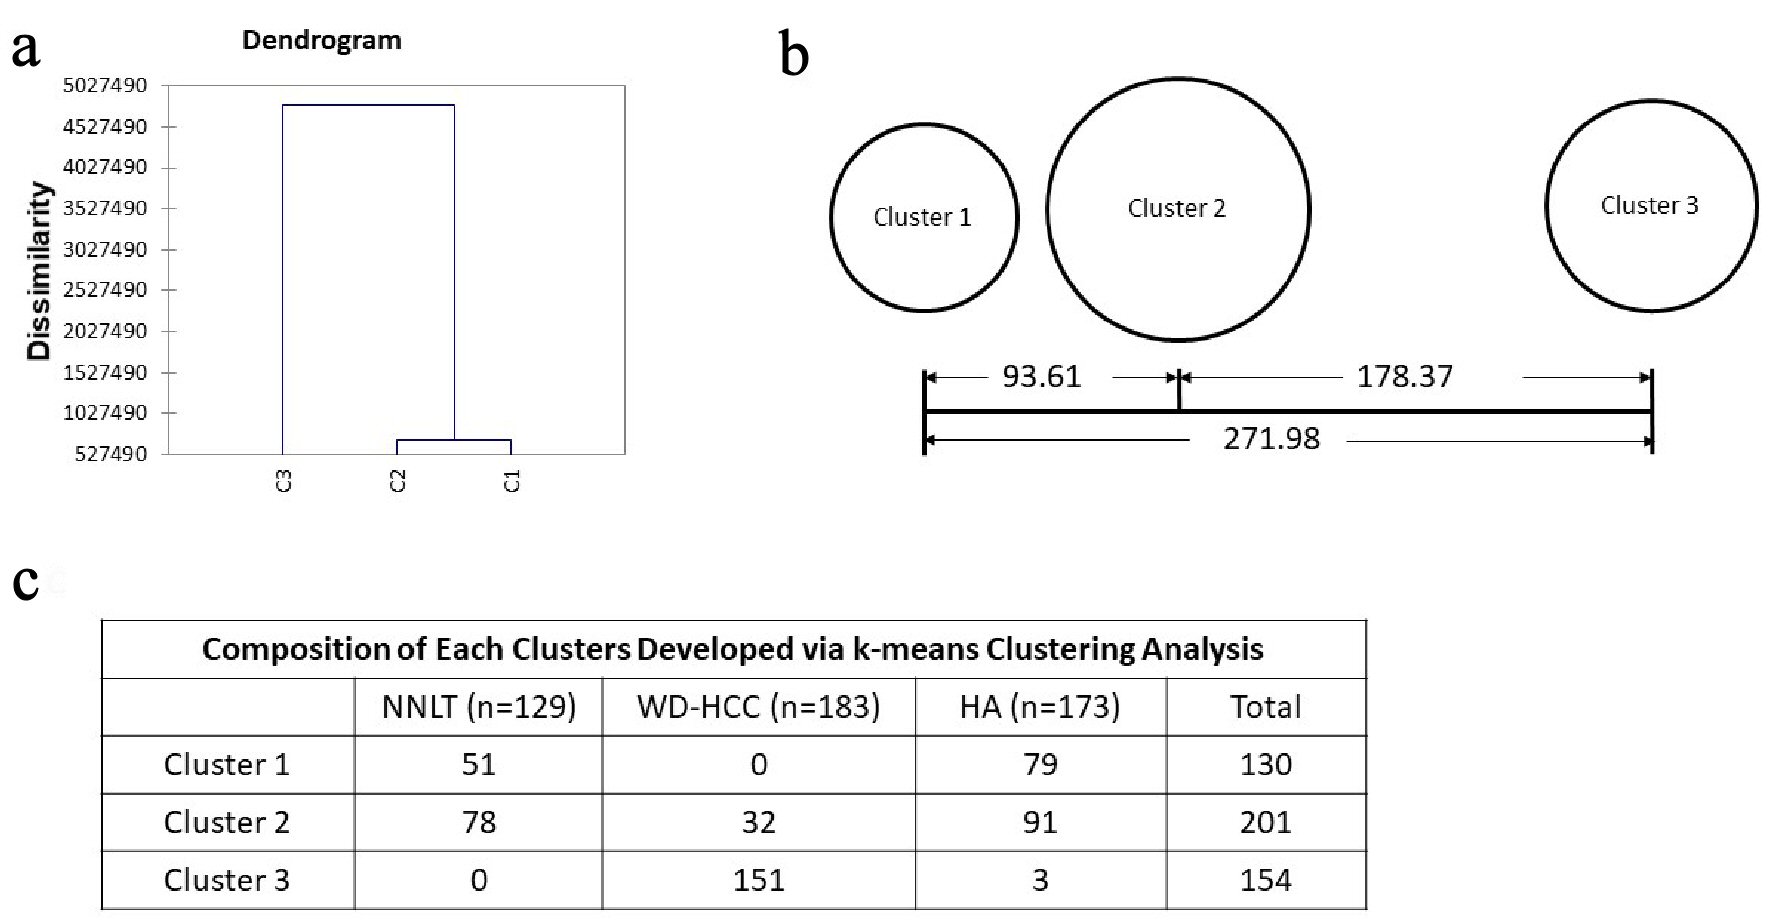
Figure 5. Unsupervised clustering. (a) Dendrogram developed with hierarchical clustering analysis. Dissimilarity is decided with euclidean distance. (b) Distances between the final cluster centers developed with k-means clustering analysis. (c) Composition of each cluster developed via k-means clustering analysis.
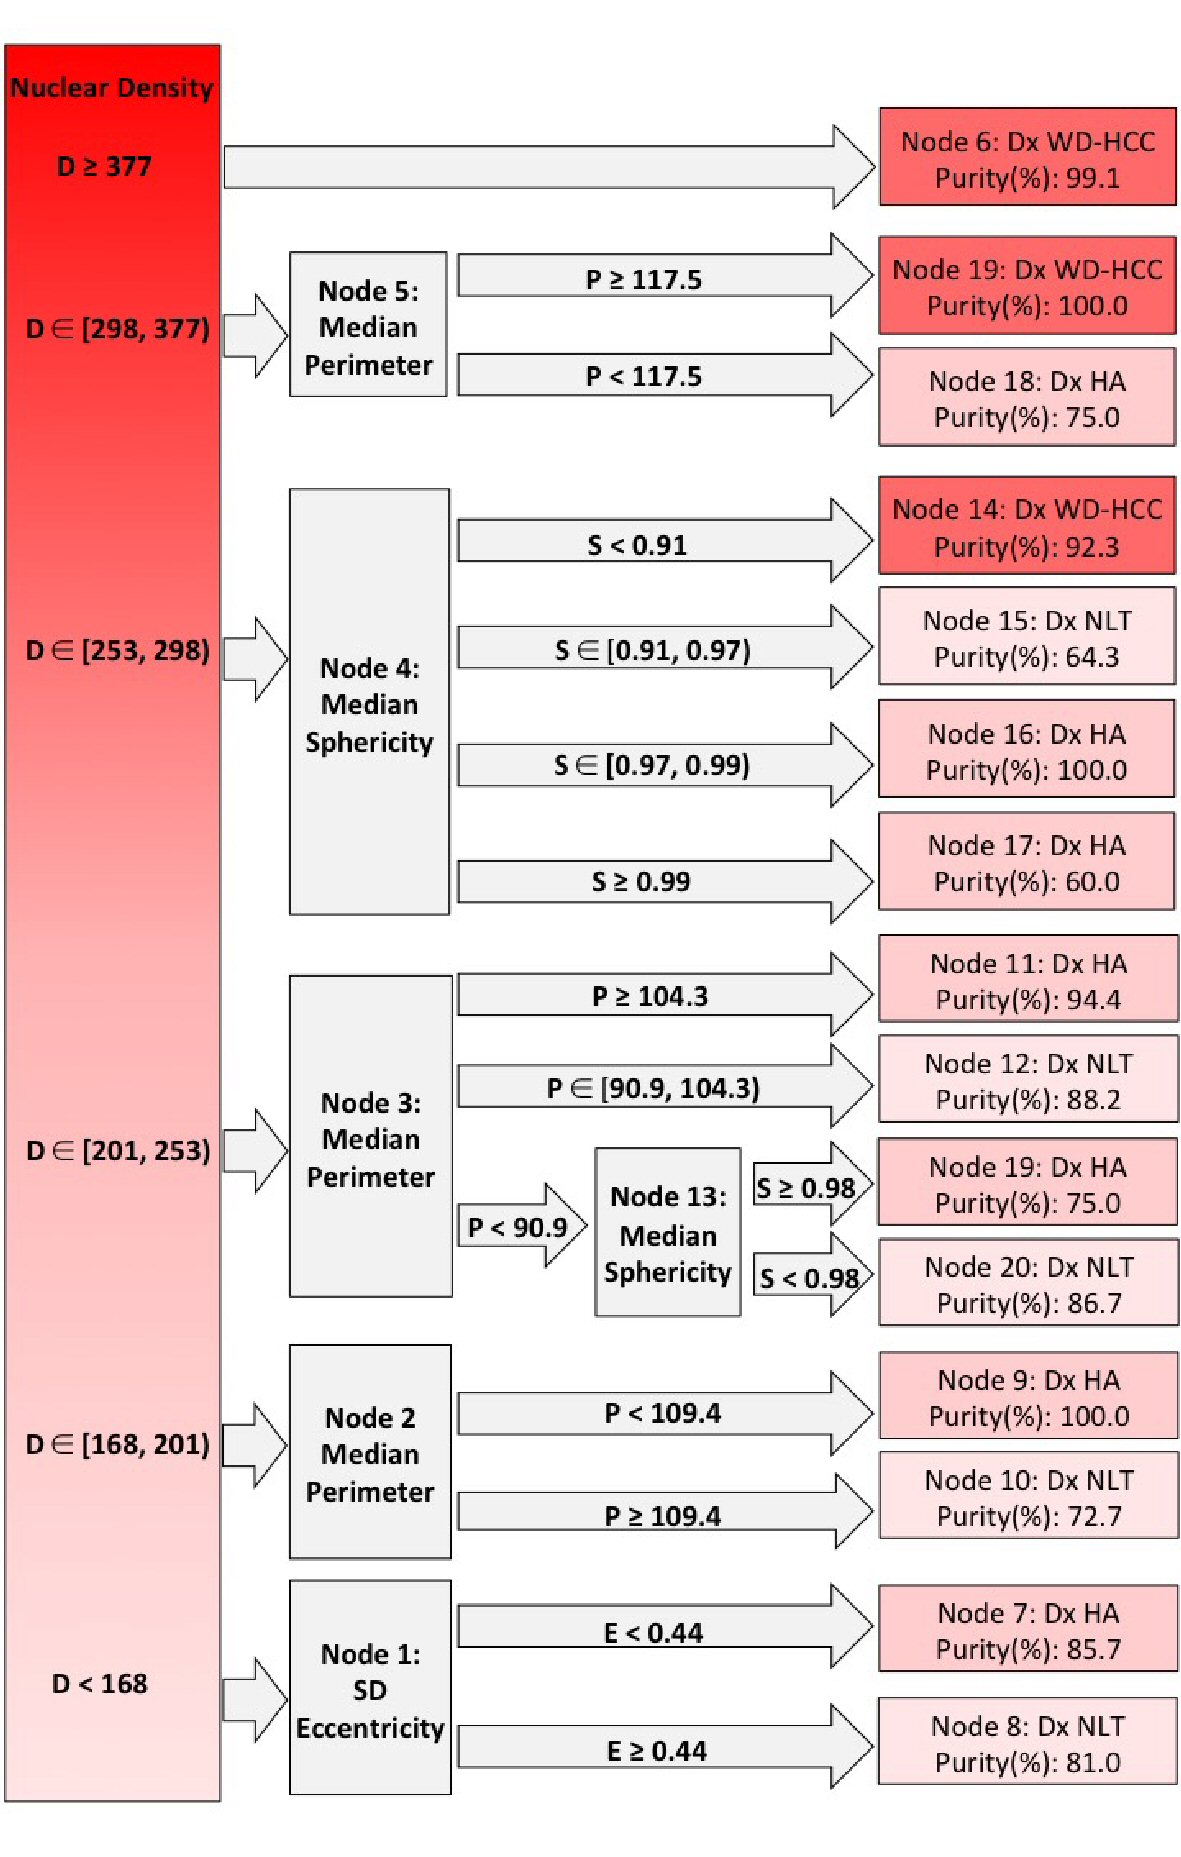
Figure 6. Decision tree from Chi-square automatic interaction detection (CHAID) analysis. Columns left to right: root nodes; decision nodes; terminal nodes. Shades of red from dark to light indicate well-differentiated hepatocellular carcinoma (WD-HCC), hepatocellular adenoma (HA), and non-neoplastic liver tissue (NNLT), respectively. Purity of each diagnosis is given in terminal nodes. D: nuclear density; E: standard deviation (SD) nuclear eccentricity; P: median nuclear perimeter; S: median nuclear sphericity. ∊: a set (number 1, number 2); ): number included in analysis; [: number excluded from analysis.
Tables
Table 1. Summary of Means of Quantified Nuclear Features
| HA: hepatocellular adenoma; NNLT: non-neoplastic liver tissue; SD: standard deviation; WD-HCC: well-differentiated hepatocellular carcinoma. |
| Nuclear density | 227.25 ± 48.88 | 230.13 ± 65.58 | 421.48 ± 80.32 | F(2, 488) = 464.4, P < 0.001 | WD-HCC vs. NNLT |
| | | | | WD-HCC vs. HA |
| Median nuclear perimeter | 104.45 ± 16.93 | 96.61 ± 16.03 | 122.94 ± 17.72 | F(2, 488) = 114.3, P < 0.001 | WD-HCC vs. NNLT |
| | | | | WD-HCC vs. HA |
| | | | | NNLT vs. HA |
| Median nuclear sphericity | 0.98 ± 0.19 | 0.98 ± 0.19 | 0.92 ± 0.06 | F(2, 488) = 103.1, P < 0.001 | WD-HCC vs. NNLT |
| | | | | WD-HCC vs. HA |
| SD nuclear eccentricity | 0.43 ± 0.09 | 0.39 ± 0.05 | 0.54 ± 0.09 | F(2, 488) = 148.0, P < 0.001 | WD-HCC vs. NNLT |
| | | | | WD-HCC vs. HA |
| | | | | NNLT vs. HA |
Table 2. List of Sensitivities and Specificities of the CHAID Analysis for Detection of WD-HCC, HA, and NNLT on the Training, Test Data, and Whole Slide Images
| | HA | NNLT | WD-HCC | Sensitivity | Specificity |
|---|
| aThe algorithm classified all three HA as NNLT in whole slide scans. CHAID: Chi-square automatic interaction detection; HA: hepatocellular adenoma; NNLT: non-neoplastic liver tissue; SD: standard deviation; WD-HCC: well-differentiated hepatocellular carcinoma. |
| Training | HA (135) | 111 | 22 | 2 | 82% | 93% |
| NNLT (99) | 15 | 84 | 0 | 85% | 92% |
| WD-HCC (149) | 2 | 1 | 146 | 98% | 99% |
| Test | HA (38) | 27 | 10 | 1 | 71% | 86% |
| NNLT (30) | 9 | 21 | 0 | 70% | 86% |
| WD-HCC (34) | 0 | 0 | 34 | 100% | 99% |
| Whole slide scans | HA (3) | 0 | 3 | 0 | 0% | 100%a |
| NNLT (3) | 0 | 3 | 0 | 100% | 50%a |
| WD-HCC (3) | 0 | 0 | 3 | 100% | 100% |