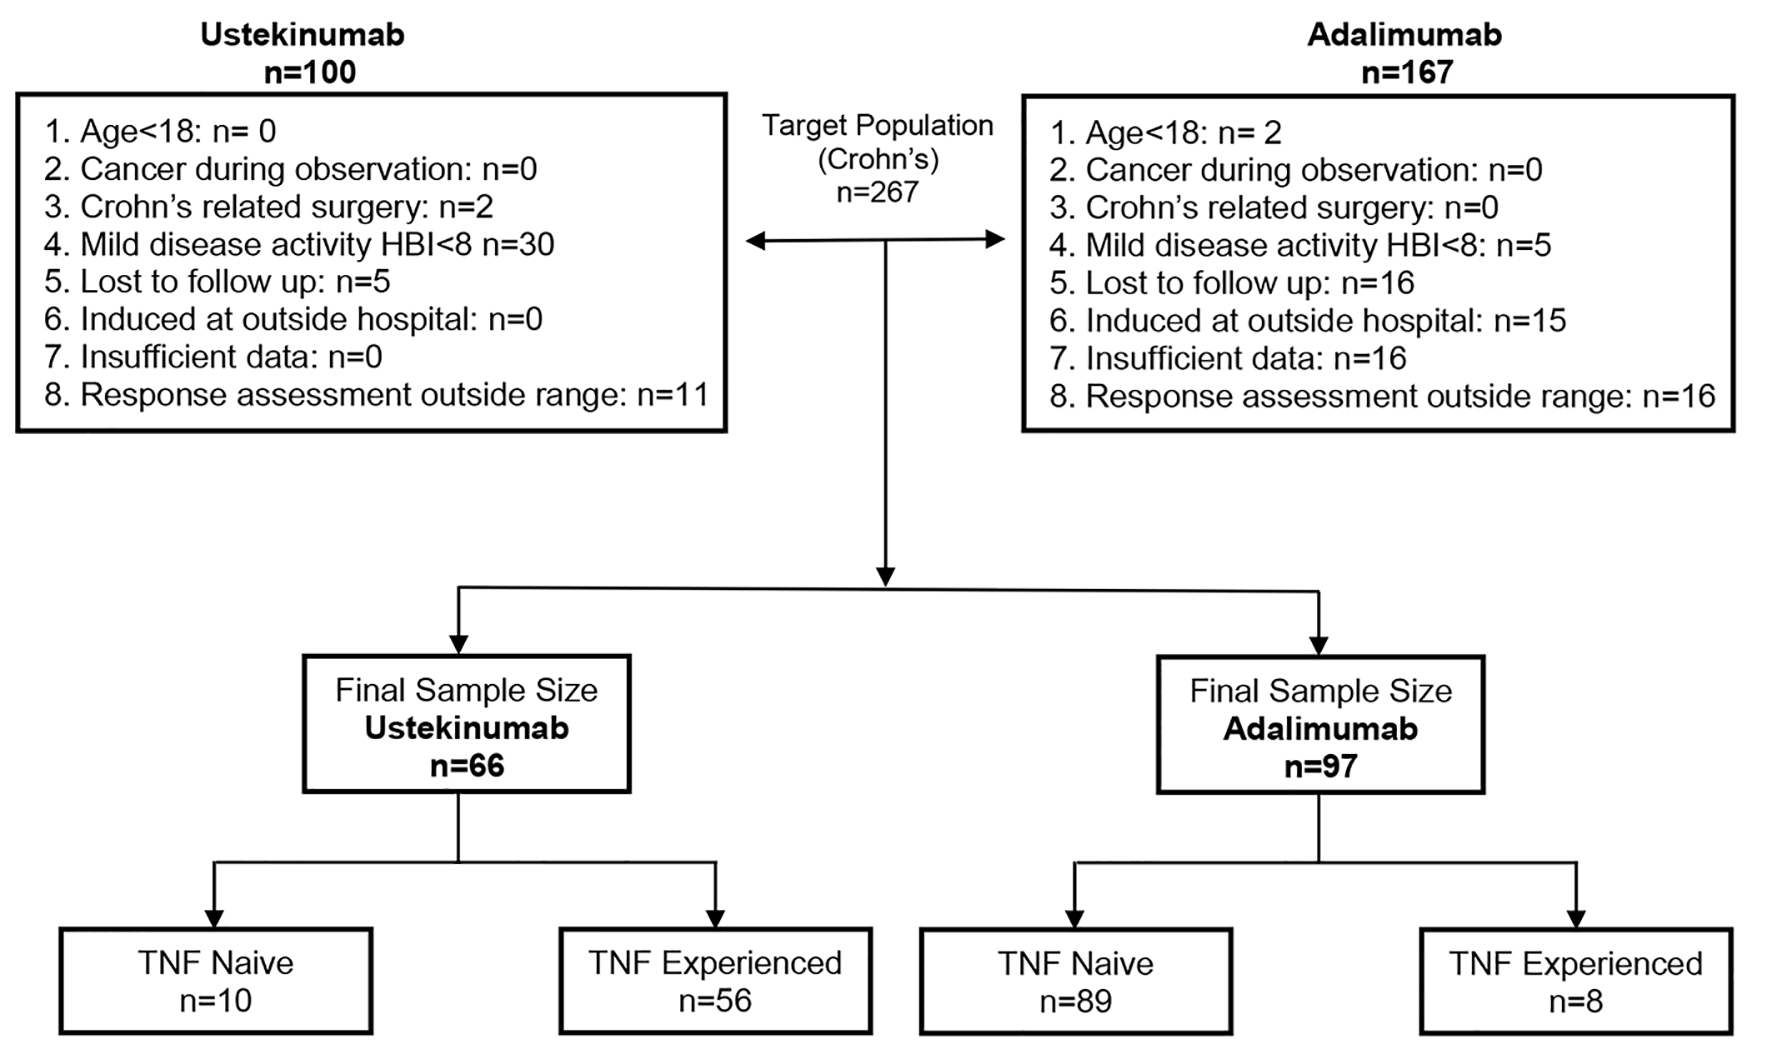
Figure 1. Flow chart showing the criteria for included patients.
| Gastroenterology Research, ISSN 1918-2805 print, 1918-2813 online, Open Access |
| Article copyright, the authors; Journal compilation copyright, Gastroenterol Res and Elmer Press Inc |
| Journal website http://www.gastrores.org |
Original Article
Volume 12, Number 5, October 2019, pages 245-251
Comparative Effectiveness of Ustekinumab Versus Adalimumab in Induction of Clinical Response and Remission in Crohn’s Disease: Experience of a Real-World Cohort at a Tertiary Care Inflammatory Bowel Disease Referral Center
Figure
Tables
| Ustekinumab (n = 66) | Adalimumab (n = 97) | P value | |
|---|---|---|---|
| SD: standard deviation; TNF: tumor necrosis factor; BMI: body mass index; PPI: proton pump inhibitor; SB: small bowel; GI: gastrointestinal. | |||
| Eligible, N | 66 | 97 | |
| Age (years), mean (SD) | 42.5 (15.9) | 40 (13.6) | 0.287 |
| Duration of disease (years), mean (SD)* | 11.8 (11.5) | 8.6 (9.4) | 0.026 |
| Race, % | 0.509 | ||
| Non-Hispanic white | 47 (71.2%) | 76 (78.4%) | |
| African American | 18 (27.3%) | 19 (19.6%) | |
| Female, n (%) | 43 (65.2%) | 62 (63.9%) | 0.872 |
| Nicotine use, n (%) | 8 (12.3%) | 22 (23.2%) | 0.084 |
| Steroid use, n (%) | 17 (25.8%) | 22 (22.7%) | 0.651 |
| Mesalamine use, n (%) | 9 (13.6%) | 11 (11.3%) | 0.661 |
| Thiopurine use, n (%)* | 23 (34.8%) | 19 (19.6%) | 0.029 |
| Methotrexate use, n (%) | 7 (10.6%) | 13 (13.4%) | 0.593 |
| TNF-experienced, n (%)* | 56 (84.8%) | 8 (8.2%) | < 0.00012 |
| Vedolizumab-experienced, n (%)* | 19 (28.8%) | 1 (1.0%) | < 0.00012 |
| Vitamin D level | 0.905 | ||
| Optimal | 18 (27.3%) | 16 (16.5%) | |
| Sub-optimal | 31 (47.0%) | 29 (29.9%) | |
| Missing data | 17 (25.7%) | 52 (53.6%) | |
| PPI use, n (%) | 30 (46.2%) | 30 (31.3%) | 0.055 |
| BMI (kg/m2) | 0.227 | ||
| Underweight (< 18.5) | 6 (9.1%) | 9 (9.3%) | |
| Normal weight (18.5 - 24.9) | 26 (39.4%) | 31 (32.0) | |
| Overweight (25 - 29.9) | 19 (28.8%) | 26 (26.8) | |
| Obese (≥ 30) | 15 (22.7%) | 31 (32.0) | |
| Type 2 diabetes, n (%)* | 8 (12.1%) | 3 (3.1%) | 0.024 |
| Hypertension, n (%) | 15 (22.7%) | 11 (11.3%) | 0.051 |
| Disease location, n (%) | 0.822 | ||
| Ileal/SB | 12 (18.2%) | 19 (19.6%) | |
| Colonic/ilecolonic | 54 (81.8%) | 78 (80.4%) | |
| Isolated upper GI | 0 (0) | 0 (0) | |
| Disease behavior, n (%)* | 0.0084 | ||
| Stricturing/penetrating | 47 (71.2%) | 49 (50.5%) | |
| Inflammatory | 19 (28.8%) | 48 (49.5%) | |
| Perianal disease, n (%)* | 25 (37.9%) | 17 (17.5%) | 0.0035 |
| Group | Total, N | Clinical response, N (%) | Unadjusted OR (95% CI), P-value | Adjusted* OR (95% CI), P-value |
|---|---|---|---|---|
| *Adjusted for age, gender, race, duration of disease and vedolizumab experience. | ||||
| Adalimumab | 97 | 71 (73.2%) | 2.73 (1.41 - 5.28), 0.0028 | 2.40 (1.14 - 5.07), 0.0213 |
| Ustekinumab | 66 | 33 (50.0%) | ||
| Group | Total, N | Clinical remission, N (%) | Unadjusted OR (95% CI), P-value | Adjusted* OR (95% CI), P-value |
|---|---|---|---|---|
| *Adjusted for age, gender, race, duration of disease and vedolizumab experience. OR: odds ratio; TNF: tumor necrosis factor; CI: confidence interval. | ||||
| Adalimumab | 97 | 43 (44.3%) | 2.08 (1.06 - 4.08), 0.0336 | 2.35 (1.07 - 5.16), 0.0337 |
| Ustekinumab | 65 | 18 (27.7%) | ||
| Group | Total, N | Clinical response, N (%) | Unadjusted OR (95% CI), P-value | Adjusted* OR (95% CI), P-value |
|---|---|---|---|---|
| *Adjusted for age and gender. OR: odds ratio; TNF: tumor necrosis factor; CI: confidence interval. | ||||
| Adalimumab | 89 | 69 (77.5%) | 5.17 (1.33 - 20.15), 0.0178 | 4.26 (1.08 - 16.84), 0.0390 |
| Ustekinumab | 10 | 4 (40.0%) | ||
| Group | Total, N | Clinical remission, N (%) | Unadjusted OR (95% CI), P-value | Adjusted* OR (95% CI), P-value |
|---|---|---|---|---|
| *Adjusted for age and gender. OR: odds ratio; TNF: tumor necrosis factor; CI: confidence interval. | ||||
| Adalimumab | 89 | 41 (46.1%) | 1.71 (0.40 - 7.26), 0.4684 | 1.64 (0.39 - 6.97), 0.5033 |
| Ustekinumab | 9 | 3 (33.3%) | ||
| Group | Total, N | Clinical response, N (%) | Unadjusted OR (95% CI), P-value | Adjusted* OR (95% CI), P-value |
|---|---|---|---|---|
| *Adjusted for age and gender. OR: odds ratio; TNF: tumor necrosis factor; CI: confidence interval. | ||||
| Adalimumab | 8 | 2 (25.0%) | 0.31 (0.06 - 1.67), 0.1732 | 0.38 (0.07 - 1.94), 0.2441 |
| Ustekinumab | 56 | 29 (51.8%) | ||
| Group | Total, N | Clinical remission, N (%) | Unadjusted OR (95% CI), P-value | Adjusted* OR (95% CI), P-value |
|---|---|---|---|---|
| *Adjusted for age and gender. OR: odds ratio; TNF: tumor necrosis factor; CI: confidence interval. | ||||
| Adalimumab | 8 | 2 (25.0%) | 0.91 (0.17 - 5.02), 0.9148 | 1.22 (0.22 - 6.81), 0.8201 |
| Ustekinumab | 56 | 15 (26.8%) | ||