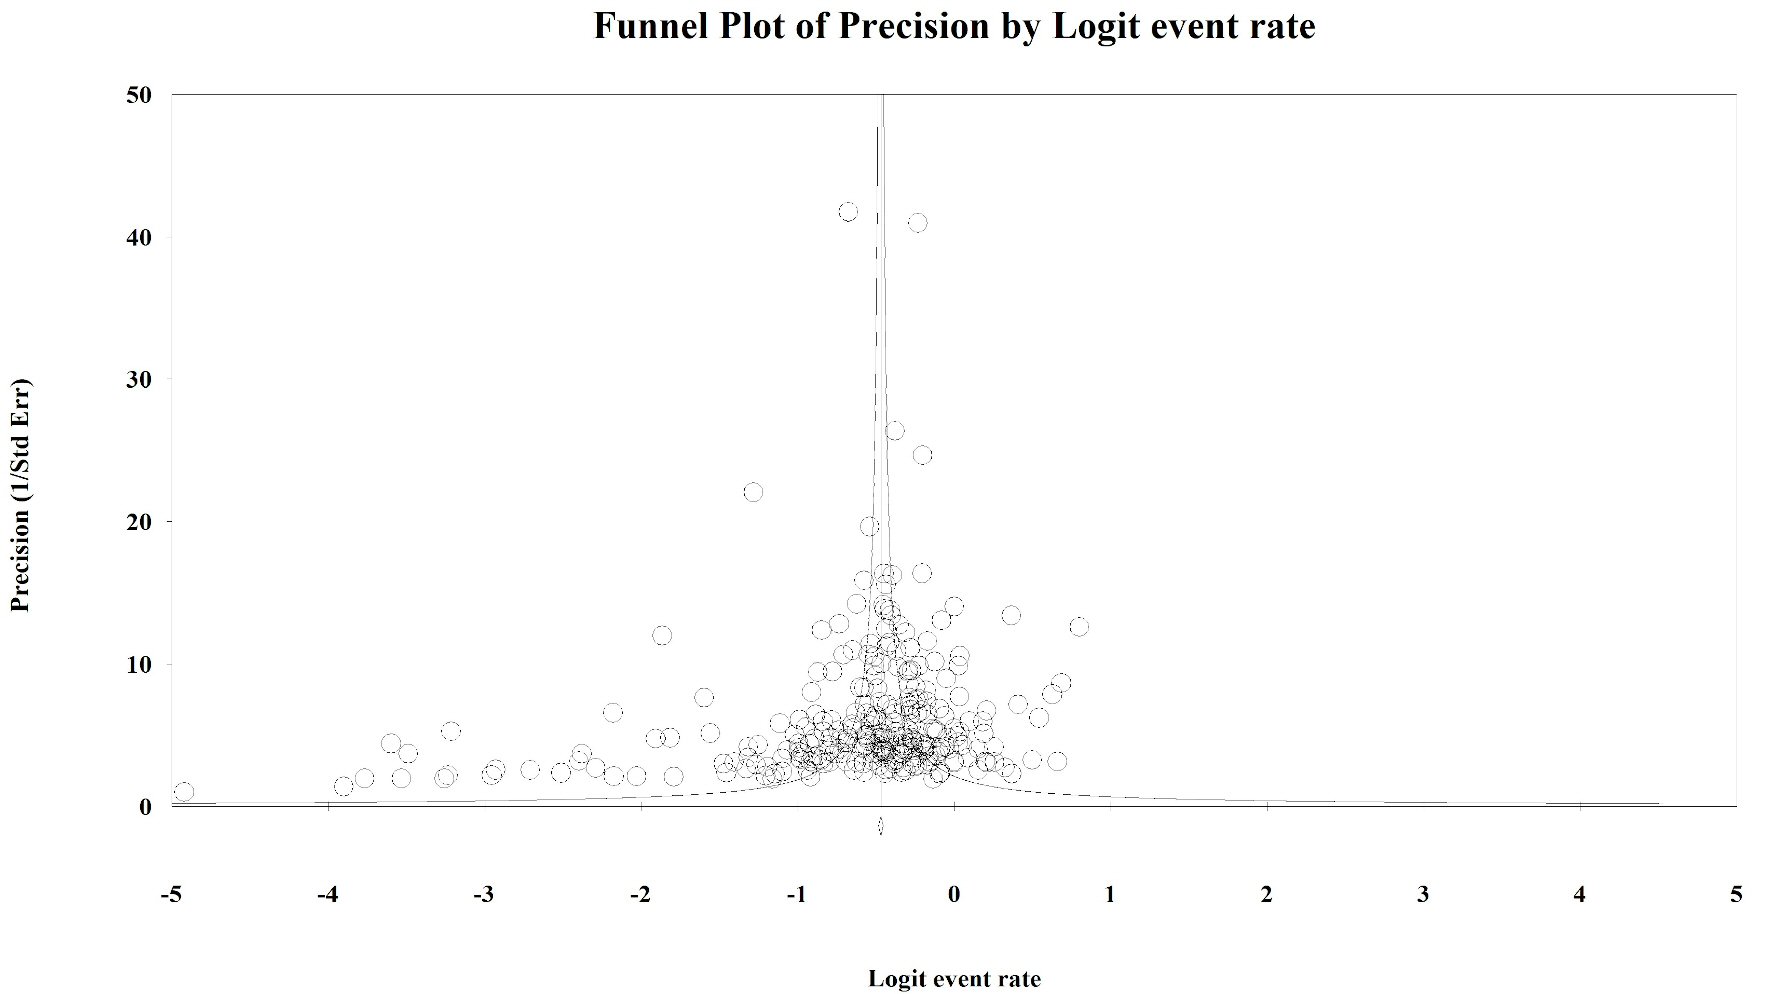
Figure 1. Publication bias: KRAS. Egger’s regression test: two-tailed P value = 0.014. Duval and Tweedie method added 64 “missing” studies to the left of the mean, resulting in an adjusted prevalence estimate of 31.7% (30.3% - 33.2%).
| Gastroenterology Research, ISSN 1918-2805 print, 1918-2813 online, Open Access |
| Article copyright, the authors; Journal compilation copyright, Gastroenterol Res and Elmer Press Inc |
| Journal website https://www.gastrores.org |
Original Article
Volume 13, Number 5, October 2020, pages 184-198
A Systematic Literature Review and Meta-Analysis Describing the Prevalence of KRAS, NRAS, and BRAF Gene Mutations in Metastatic Colorectal Cancer
Figures
Tables
| N studiesf | Summary prevalence (95% CI) | P-Het; I2 | P value for heterogeneity within subgroups | |
|---|---|---|---|---|
| aGlobal exon estimate (most global estimate for a given exon contained within a manuscript); bCodon specified in papers as existing within exon 2; cCodon specified in papers as existing within exon 1, exon 2, or unspecified; dP values assess differences between global exon estimates only; eCategories not mutually exclusive as some studies used multiple forms of mutation assessment methods, P value not calculated; fIndividual studies may contribute multiple prevalence estimates derived from independent study arms; so N refers to the number of independent prevalence estimates included in summary measure and may exceed the actual number of studies. mCRC: metastatic colorectal cancer; CI: confidence interval. | ||||
| Overall | 288 | 35.9% (34.6% - 37.3%) | < 0.001; 92.6% | |
| Exon 1a | 14 | 35.5% (30.3% - 41.1%) | < 0.001; 75.4% | |
| Exon 2a | 76 | 39.1% (37.1% - 41.3%) | < 0.001; 85.4% | |
| Codon 12b | 24 | 29.1% (26.3% - 32.1%) | < 0.001; 86.2% | |
| Codon 12c | 50 | 29.0% (26.9% - 31.2%) | < 0.001; 83.9% | |
| Gly12Ala | 59 | 3.3% (2.7% - 3.9%) | < 0.001; 77.8% | < 0.001 |
| Gly12Arg | 36 | 0.9% (0.6% - 1.4%) | < 0.001; 82.9% | |
| Gly12Asp | 85 | 14.6% (13.3% - 16.1%) | < 0.001; 90.8% | |
| Gly12Cys | 61 | 3.5% (3.0% - 4.1%) | < 0.001; 76.1% | |
| Gly12Phe | 5 | 0.2% (0.1% - 0.6%) | 0.035; 61.3% | |
| Gly12Ser | 62 | 2.8% (2.2% - 3.6%) | < 0.001; 88.8% | |
| Gly12Val | 87 | 10.2% (9.1% - 11.4%) | < 0.001; 89.6% | |
| Other codon 12 | 15 | 0.9% (0.3% - 2.9%) | < 0.001; 96.9% | |
| Codon 13b | 19 | 9.0% (7.9% - 10.2%) | < 0.001; 62.7% | |
| Codon 13c | 39 | 8.6% (7.7% - 9.5%) | < 0.001; 55.2% | |
| Gly13Arg | 8 | 0.2% (0.1% - 0.7%) | 0.001; 72.0% | < 0.001 |
| Gly13Asp | 82 | 8.6% (7.6% - 9.6%) | < 0.001; 85.0% | |
| Gly13Cys | 15 | 0.7% (0.4% - 1.2%) | < 0.001; 82.7% | |
| Gly13Ser | 4 | 0.3% (0.0% - 4.8%) | < 0.001; 90.9% | |
| Gly13Val | 8 | 0.4% (0.1% - 1.8%) | < 0.001; 80.2% | |
| Exon 3a | 9 | 2.9% (1.9% - 4.4%) | 0.009; 60.9% | |
| Codon 61 | 14 | 2.7% (2.1% - 3.5%) | 0.001; 62.0% | |
| Gln61Arg | 4 | 0.4% (0.2% - 0.6%) | 0.810; 0.0% | 0.016 |
| Gln61His | 11 | 1.6% (0.7% - 3.5%) | < 0.001; 92.3% | |
| Gln61Leu | 5 | 0.7% (0.2 %- 2.2%) | 0.004; 73.9% | |
| Other codon 61 | 3 | 0.2% (0.0% - 1.8%) | < 0.001; 89.3% | |
| Exon 4a | 8 | 5.0% (4.1% - 6.2%) | 0.228; 25.2% | |
| Codon 146 | 9 | 2.5% (1.9% - 3.3%) | 0.134; 35.5% | |
| P value between exonsd | < 0.001 | |||
| Sex | ||||
| Male | 55 | 37.3% (35.1% - 39.7%) | < 0.001; 76.9% | 0.011 |
| Female | 57 | 42.2% (39.3% - 45.2%) | < 0.001; 81.7% | |
| Median age of study population | ||||
| < 62 | 77 | 37.0% (34.3% - 39.8%) | < 0.001; 92.6% | 0.544 |
| ≥ 62 | 102 | 36.0% (33.8% - 38.1%) | < 0.001; 90.6% | |
| Meta-regression on median age | 179 | 0.004 (-0.012 - 0.020) | N/A | 0.612 |
| Race | ||||
| < 88% White/Caucasian | 21 | 37.8% (32.4% - 43.4%) | < 0.001; 94.1% | 0.401 |
| ≥ 88% White/Caucasian | 17 | 34.1% (28.1% - 40.7%) | < 0.001; 91.1% | |
| Study location | ||||
| Asia | 64 | 31.8% (28.3% - 35.5%) | < 0.001; 93.2% | 0.025 |
| Australia | 7 | 27.3% (19.1% - 37.5%) | < 0.001; 97.9% | |
| Europe | 146 | 37.3% (35.2% - 39.3%) | < 0.001; 92.0% | |
| Multi-country | 21 | 39.4% (36.1% - 42.9%) | < 0.001; 88.2% | |
| North America | 47 | 36.4% (33.4% - 39.6%) | < 0.001; 88.9% | |
| South America | 3 | 37.2% (28.7% - 49.9%) | < 0.001; 70.8% | |
| Study design | ||||
| Observational | 226 | 35.0% (33.5% - 36.6%) | < 0.001; 92.9% | 0.004 |
| Clinical trial | 62 | 39.5% (36.9% - 42.1%) | < 0.001; 89.0% | |
| Treatment status | ||||
| Partial population treated | 10 | 27.5% (18.0% - 39.6%) | < 0.001; 95.0% | 0.115 |
| Complete population treated | 158 | 37.2% (35.6% - 38.9%) | < 0.001; 89.6% | |
| Unknown/not treated | 120 | 35.1% (32.9% - 37.4%) | < 0.001; 94.2% | |
| Source | ||||
| Primary tumor | 60 | 18.9% (15.6% - 22.7%) | < 0.001; 94.6% | 0.012 |
| Metastasis | 37 | 21.2% (16.4% - 27.0%) | < 0.001; 94.3% | |
| Both primary tumors and metastases | 42 | 26.5% (23.0% - 30.4%) | < 0.001; 96.4% | |
| Mutation assessment methode | ||||
| Gel electrophoresis methods | 13 | 41.1% (35.7% - 46.6%) | 0.001; 65.5% | |
| High-resolution melting | 18 | 28.8% (23.7% - 34.6%) | < 0.001; 97.3% | |
| Mass spectrometry | 17 | 36.0% (32.2% - 40.0%) | < 0.001; 92.2% | |
| Multiplex mutation assays | 20 | 36.4% (33.1% - 39.9%) | < 0.001; 87.2% | |
| Mutant allele specific PCR | 77 | 37.4% (35.1% - 39.8%) | < 0.001; 92.2% | |
| Next-generation sequencing | 11 | 29.7% (20.1% - 41.7%) | < 0.001; 97.1% | |
| Pyrosequencing | 38 | 37.2% (33.9% - 40.6%) | < 0.001; 88.9% | |
| Sanger/direct sequencing (PCR) | 144 | 35.5% (34.0% - 37.0%) | < 0.001; 86.3% | |
| Strip assay | 7 | 42.1% (38.9% - 45.3%) | 0.045; 53.4% | |
| Other | 16 | 44.0% (37.4% - 50.7%) | < 0.001; 96.3% | |
| Not reported | 14 | 40.3% (33.1% - 47.9%) | < 0.001; 96.1% | |
| Study quality score | ||||
| ≤ 16 | 172 | 35.0% (33.1% - 37.0%) | < 0.001; 94.5% | 0.073 |
| > 16 | 116 | 37.5% (35.7% - 39.3%) | < 0.001; 85.4% | |
| Study time period | ||||
| Pre-2007 | 22 | 35.5% (32.3% - 38.9%) | < 0.001; 63.9% | 0.105 |
| Includes 2007 | 115 | 36.0% (33.7% - 38.4%) | < 0.001; 90.0% | |
| Post-2007 | 61 | 39.3% (36.7% - 42.0%) | < 0.001; 91.5% | |
| Median length of follow-up time | ||||
| < 25 months | 29 | 34.6% (31.1% - 38.3%) | < 0.001; 80.9% | 0.608 |
| ≥ 25 months | 34 | 33.0% (28.1% - 38.3%) | < 0.001; 91.7% | |
| Meta-regression on follow-up time | 63 | 0.002 (-0.004 - 0.008) | N/A | 0.583 |
| N studiesc | Summary prevalence (95% CI) | P-Het; I2 | P value for heterogeneity within subgroups | |
|---|---|---|---|---|
| aGlobal exon estimate (most global estimate for a given exon contained within a manuscript); bCategories not mutually exclusive as some studies used multiple forms of mutation assessment methods, P value not calculated; cIndividual studies may contribute multiple prevalence estimates derived from independent study arms, so N refers to the number of independent prevalence estimates included in summary measure and may exceed the actual number of studies. mCRC: metastatic colorectal cancer; CI: confidence interval. | ||||
| Overall | 142 | 7.1% (6.5% - 7.8%) | < 0.001; 66.3% | |
| Exon 15a | 44 | 7.0% (6.1% - 8.1%) | 0.001; 45.8% | |
| Val600Glu (V600E) | 75 | 6.8% (5.8% - 7.9%) | < 0.001; 76.9% | 0.002 |
| Asp594Gly | 4 | 0.6% (0.1% - 2.8%) | 0.064; 58.8% | |
| Sex | ||||
| Male | 12 | 7.9% (6.5% - 9.7%) | 0.076; 39.7% | 0.018 |
| Female | 12 | 11.0% (9.2% - 13.1%) | 0.260; 18.7% | |
| Median age of study population | ||||
| < 62 | 35 | 7.8% (6.6% - 9.1%) | < 0.001; 55.5% | 0.970 |
| ≥ 62 | 57 | 7.8% (6.7% - 9.1%) | < 0.001; 68.6% | |
| Meta-regression on median age | 92 | 0.012 (-0.014 - 0.036) | N/A | 0.390 |
| Race | ||||
| < 88% White/Caucasian | 7 | 7.1% (5.5% - 9.2%) | 0.915; 0.0% | 0.855 |
| ≥ 88% White/Caucasian | 5 | 7.6% (4.1% - 13.7%) | 0.007; 71.7% | |
| Study location | ||||
| Asia | 29 | 6.0% (5.1% - 7.0%) | 0.175; 19.6% | 0.002 |
| Australia | 7 | 11.1% (8.6% - 14.2%) | 0.062; 49.9% | |
| Europe | 79 | 7.2% (6.3% - 8.1%) | < 0.001; 68.2% | |
| Multi-country | 8 | 8.3% (5.4% - 12.5%) | < 0.001; 83.3% | |
| North America | 19 | 6.6% (5.1% - 8.4%) | 0.001; 56.5% | |
| Study design | ||||
| Observational | 114 | 7.2% (6.5% - 7.9%) | < 0.001; 65.4% | 0.897 |
| Clinical trial | 28 | 7.1% (5.7% - 8.7%) | < 0.001; 70.5% | |
| Treatment status | ||||
| Partial population treated | 8 | 5.9% (3.9% - 8.9%) | 0.168; 32.6% | 0.659 |
| Complete population treated | 76 | 7.2% (6.3% - 8.3%) | < 0.001; 72.1% | |
| Unknown/not treated | 58 | 7.1% (6.3% - 8.0%) | < 0.001; 57.3% | |
| Source | ||||
| Primary tumor | 34 | 7.5% (6.3% - 8.7%) | 0.152; 20.1% | 0.832 |
| Metastasis | 16 | 6.4% (3.8% - 10.6%) | < 0.001; 68.3% | |
| Both primary tumors and metastases | 20 | 7.1% (5.8% - 8.5%) | 0.039; 39.0% | |
| Mutation assessment methodb | ||||
| Gel electrophoresis methods | 6 | 4.5% (2.5% - 7.9%) | 0.754; 0.0% | |
| High-resolution melting | 13 | 8.0% (5.9% - 10.9%) | < 0.001; 79.0% | |
| Mass spectrometry | 13 | 5.4% (4.4% - 6.6%) | 0.044; 44.2% | |
| Multiplex mutation assays | 10 | 7.5% (5.8% - 9.6%) | 0.170; 29.9% | |
| Mutant allele specific PCR | 35 | 8.1% (7.0% - 9.2%) | < 0.001; 57.0% | |
| Next-generation sequencing | 6 | 7.4% (5.7% - 9.5%) | 0.974; 0.0% | |
| Not reported | 7 | 7.1% (4.6% - 10.9%) | 0.010; 64.2% | |
| Other | 6 | 3.9% (2.3% - 6.4%) | 0.004; 71.2% | |
| Pyrosequencing | 19 | 9.1% (7.2% - 11.4%) | < 0.001; 74.3% | |
| Sanger/direct sequencing (PCR) | 69 | 6.8% (6.1% - 7.6%) | 0.004; 33.6% | |
| Study quality score | ||||
| ≤ 16 | 70 | 7.2% (6.4% - 8.0%) | < 0.001; 58.5% | 0.803 |
| > 16 | 72 | 7.0% (6.1% - 8.1%) | < 0.001; 70.7% | |
| Study time period | ||||
| Pre-2007 | 10 | 6.3% (4.2% - 9.5%) | 0.038; 49.4% | 0.520 |
| Includes 2007 | 59 | 7.4% (6.2% - 8.7%) | < 0.001; 73.1% | |
| Post-2007 | 28 | 6.3% (4.2% - 9.5%) | 0.098; 26.7% | |
| Median length of follow-up time | ||||
| < 25 months | 12 | 9.7% (6.1% - 15.0%) | < 0.001; 71.9% | 0.271 |
| ≥ 25 months | 24 | 7.4% (6.1% - 8.8%) | 0.002; 51.6% | |
| Meta-regression on follow-up time | 36 | -0.005 (-0.015; 0.005) | N/A | 0.314 |
| N Studiese | Summary prevalence (95% CI) | P-Het; I2 | P value for heterogeneity within subgroups | |
|---|---|---|---|---|
| aGlobal exon estimate (most global estimate for a given exon contained within a manuscript); bCodon specified in papers as existing within exon 1, exon 2, exon 3 or unspecified; cP values assess differences between global exon estimates only; dCategories not mutually exclusive as some studies used multiple forms of mutation assessment methods, P value not calculated; eIndividual studies may contribute multiple prevalence estimates derived from independent study arms, so N refers to the number of independent prevalence estimates included in summary measure and may exceed the actual number of studies; fP value assesses differences between codon estimates. *N < 3, insufficient studies to run a meta-analysis. mCRC: metastatic colorectal cancer; CI: confidence interval. | ||||
| Overall | 49 | 4.1% (3.5% - 4.8%) | < 0.001; 56.0% | |
| Exon 2a | 6 | 2.3% (1.4% - 3.7%) | 0.127; 41.8% | |
| Codon 12b | 7 | 2.2% (1.6% - 3.0%) | 0.209; 28.7% | < 0.001f |
| Codon 13b | 4 | 0.7% (0.5% - 1.0%) | 0.927; 0.0% | |
| Exon 3a | 5 | 2.4% (1.1% - 5.0%) | 0.003; 75.5% | |
| Codon 61b | 10 | 3.6% (2.6% - 5.0%) | 0.065; 44.1% | |
| Exon 4a | 3 | 0.6% (0.1% - 3.9%) | 0.991; 0.0% | |
| P value between exonsc | 0.368 | |||
| Sex | ||||
| Male | * | * | * | * |
| Female | * | * | * | |
| Median age of study population | ||||
| < 62 | 12 | 3.7% (3.0% - 4.7%) | 0.863; 0.0% | 0.479 |
| ≥ 62 | 12 | 4.3% (3.2% - 5.6%) | 0.036; 47.1% | |
| Meta-regression on median age | 24 | 0.006 (-0.048 - 0.060) | N/A | 0.822 |
| Race | ||||
| < 88% White/Caucasian | * | * | * | * |
| ≥ 88% White/Caucasian | 3 | 5.8% (3.4% - 9.8%) | 0.954; 0.0% | |
| Study location | ||||
| Asia | 13 | 3.0% (2.0% - 4.5%) | 0.009; 54.5% | 0.108 |
| Australia | * | * | * | |
| Europe | 22 | 4.6% (3.7% - 5.8%) | < 0.001; 64.6% | |
| Multi-country | 3 | 5.8% (3.4% - 9.8%) | 0.954; 0.0% | |
| North America | 10 | 3.6% (2.9% - 4.5%) | 0.980; 0.0% | |
| Study design | ||||
| Observational | 39 | 3.9% (3.3% - 4.7%) | < 0.001; 61.9% | 0.105 |
| Clinical trial | 10 | 5.3% (3.9% - 7.1%) | 0.544; 0.0% | |
| Treatment status | ||||
| Partial population treated | 5 | 3.5% (2.1% - 6.0%) | 0.940; 0.0% | 0.840 |
| Complete population treated | 15 | 4.2% (3.3% - 5.3%) | 0.336; 10.5% | |
| Unknown/not treated | 29 | 4.1% (3.3% - 5.0%) | < 0.001; 69.5% | |
| Source | ||||
| Primary tumor | 8 | 3.4% (2.4% - 4.8%) | 0.026; 55.9% | 0.318 |
| Metastasis | 6 | 4.9% (3.4% - 7.0%) | 0.936; 0.0% | |
| Both primary tumors and metastases | 9 | 3.5% (2.5% - 4.9%) | 0.019; 56.3% | |
| Mutation assessment methodd | ||||
| High-resolution melting | 6 | 3.0% (1.7% - 5.1%) | < 0.001; 84.6% | |
| Mass spectrometry | 11 | 4.0% (3.2% - 5.0%) | 0.023; 51.8% | |
| Multiplex mutation assays | 4 | 4.2% (3.3% - 5.4%) | 0.233; 29.8% | |
| Mutant allele specific PCR | 7 | 4.3% (3.4% - 5.3%) | 0.253; 23.1% | |
| Next-generation sequencing | 8 | 4.9% (3.9% - 6.2%) | 0.309; 15.4% | |
| Other | 3 | 4.5% (2.6% - 7.6%) | 0.064; 63.6% | |
| Pyrosequencing | 9 | 5.1% (3.6% - 7.3%) | < 0.001; 72.4% | |
| Sanger/direct sequencing (PCR) | 20 | 4.5% (4.0% - 5.0%) | 0.483; 0.0% | |
| Strip assay | * | * | * | |
| Study quality score | ||||
| ≤ 16 | 29 | 3.8% (3.0% - 4.8%) | < 0.001; 69.0% | 0.151 |
| > 16 | 20 | 4.7% (4.0% - 5.5%) | 0.535; 0.0% | |
| Study time period | ||||
| Pre-2007 | * | * | * | |
| Includes 2007 | 9 | 3.7% (2.9% - 4.7%) | 0.447; 0.0% | 0.247 |
| Post-2007 | 26 | 4.5% (3.6% - 5.6%) | < 0.001; 63.2% | |
| Median length of follow-up time | ||||
| < 25 months | * | * | * | * |
| ≥ 25 months | 7 | 4.1% (3.0% - 5.5%) | 0.998; 0.0% | |
| Meta-regression on follow-up time | 0.000 (-0.012 - 0.012) | N/A | 0.957 | |
| Overall survival | Progression-free survival | |||||
|---|---|---|---|---|---|---|
| N studies | HR (95% CI) | P-Het; I2 | N studies | HR (95% CI) | P-Het; I2 | |
| *N < 3 (studies), insufficient for meta-analysis. mCRC: metastatic colorectal cancer; HR: hazard ratio; CI: confidence interval. | ||||||
| Survival analysis (mutant vs. wild-type) | ||||||
| KRAS | 47 | 1.49 (1.37 - 1.64) | < 0.001; 50.2% | 25 | 1.62 (1.33 - 1.97) | < 0.001; 83.1% |
| BRAF | 32 | 2.83 (2.23 - 3.58) | < 0.001; 84.1% | 12 | 2.90 (1.84 - 4.56) | < 0.001; 91.3% |
| NRAS | 4 | 1.88 (1.35 - 2.62) | 0.795; 0.0% | * | * | * |
| Median survival | Median months (95% CI) | Median months (95% CI) | ||||
| KRAS mutant | 41 | 13.41 (11.35 - 15.83) | < 0.001; 96.8% | 42 | 4.48 (3.58 - 5.62) | < 0.001; 99.2% |
| KRAS wild-type | 42 | 17.00 (14.52 - 19.89) | < 0.001; 96.8% | 49 | 5.98 (4.74 - 7.54) | < 0.001; 99.3% |
| P value for difference | 0.022 | 0.04 | ||||
| BRAF mutant | 12 | 8.71 (6.54 - 11.59) | < 0.001; 90.1% | 11 | 5.05 (3.67 - 6.96) | < 0.001; 88.6% |
| BRAF wild-type | 13 | 17.19 (13.00 - 22.74) | < 0.001; 96.6% | 12 | 8.26 (6.78 - 10.07) | < 0.001; 93.5% |
| P value for difference | < 0.001 | 0.005 | ||||