Figures

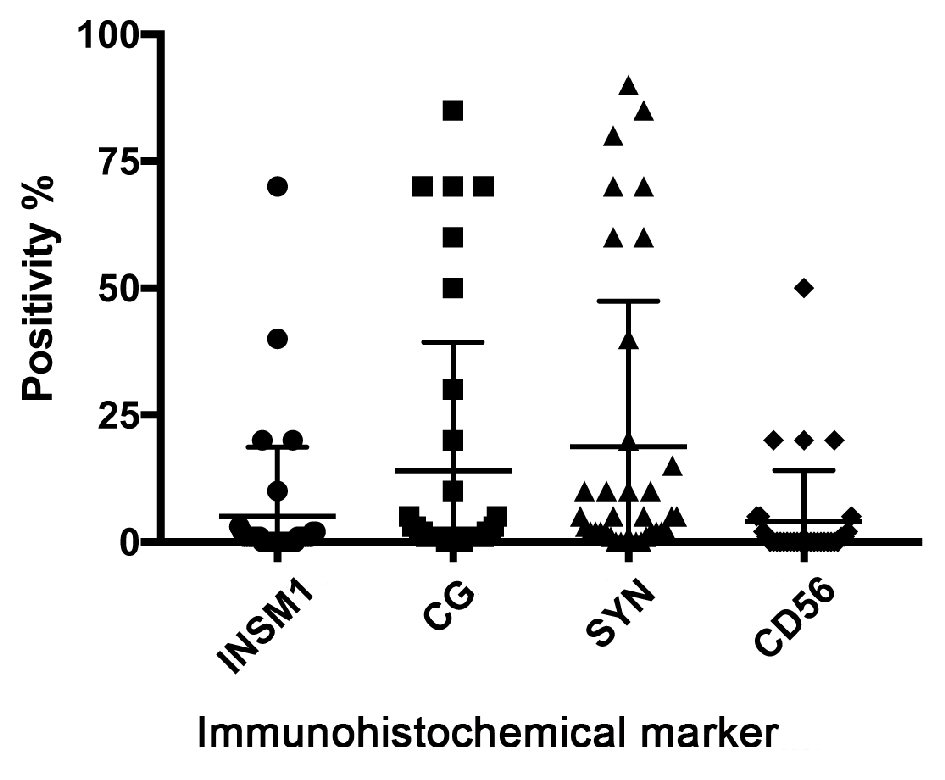
Figure 1. All studied neuroendocrine markers exhibit negative to focal expression pattern in adenocarcinoma ex-goblet cell carcinoids (primary and metastatic). The majority of cases show less than 10% staining of tumor cells with any neuroendocrine marker. Synaptophysin stain shows highest percentage of positivity, followed by chromogranin, then INSM1, with CD56 showing least percentage of positive cells. CG: chromogranin; SYN: synaptophysin.

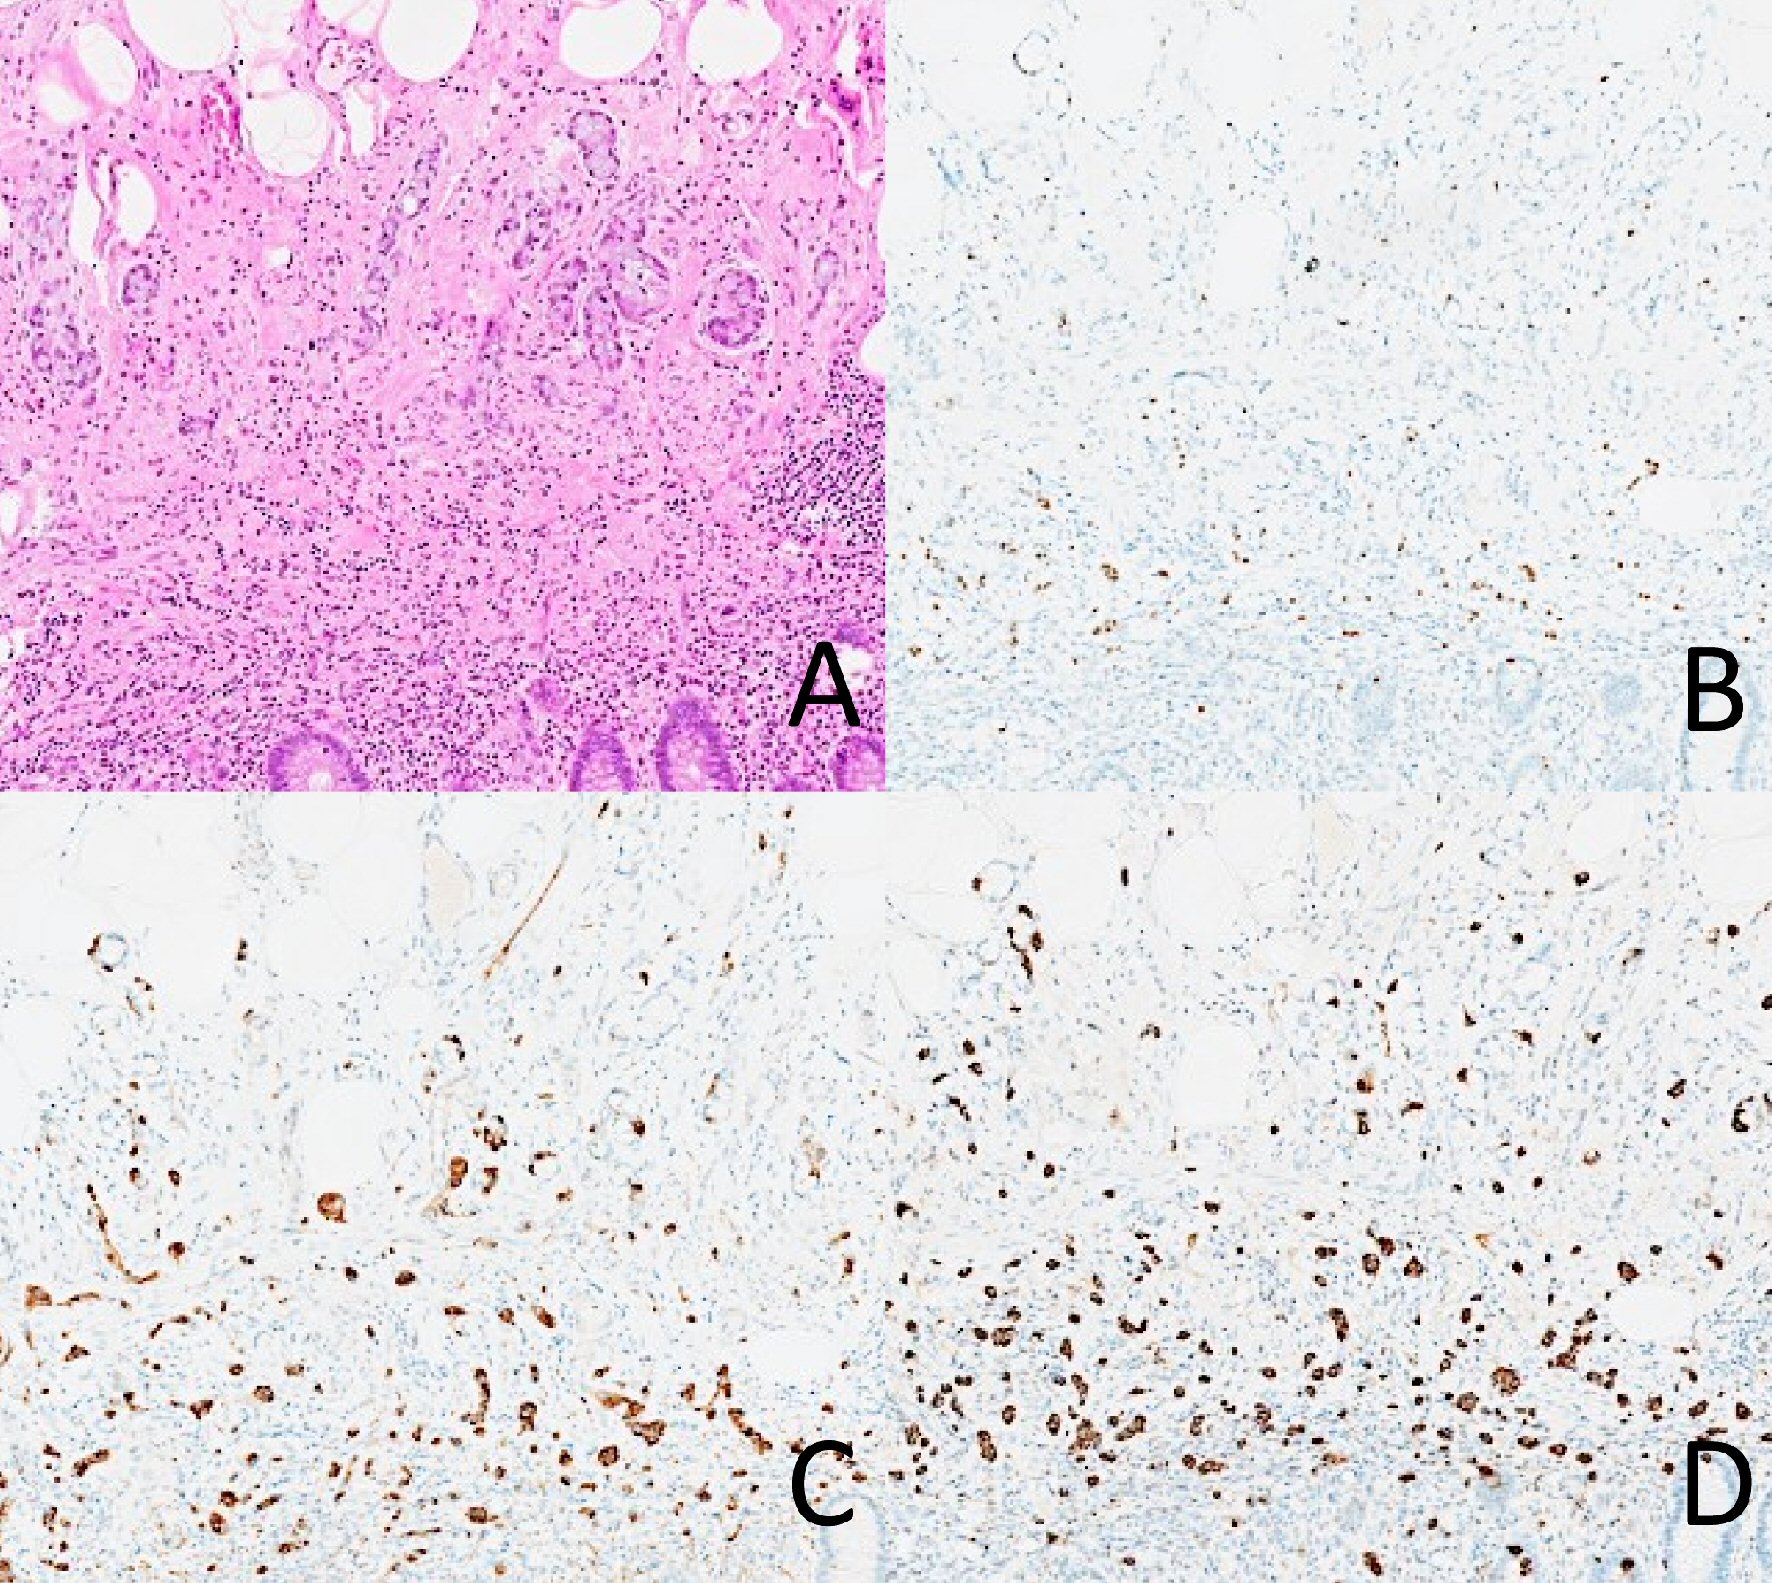
Figure 2. A case of adenocarcinoma ex-goblet cell carcinoid with positive staining for INSM1, chromogranin, and synaptophysin in the goblet cell component. There is diffuse staining of all three markers in the tumor cells. (A) Hematoxylin and eosin. (B) INSM1. (C) Chromogranin. (D) Synaptophysin.

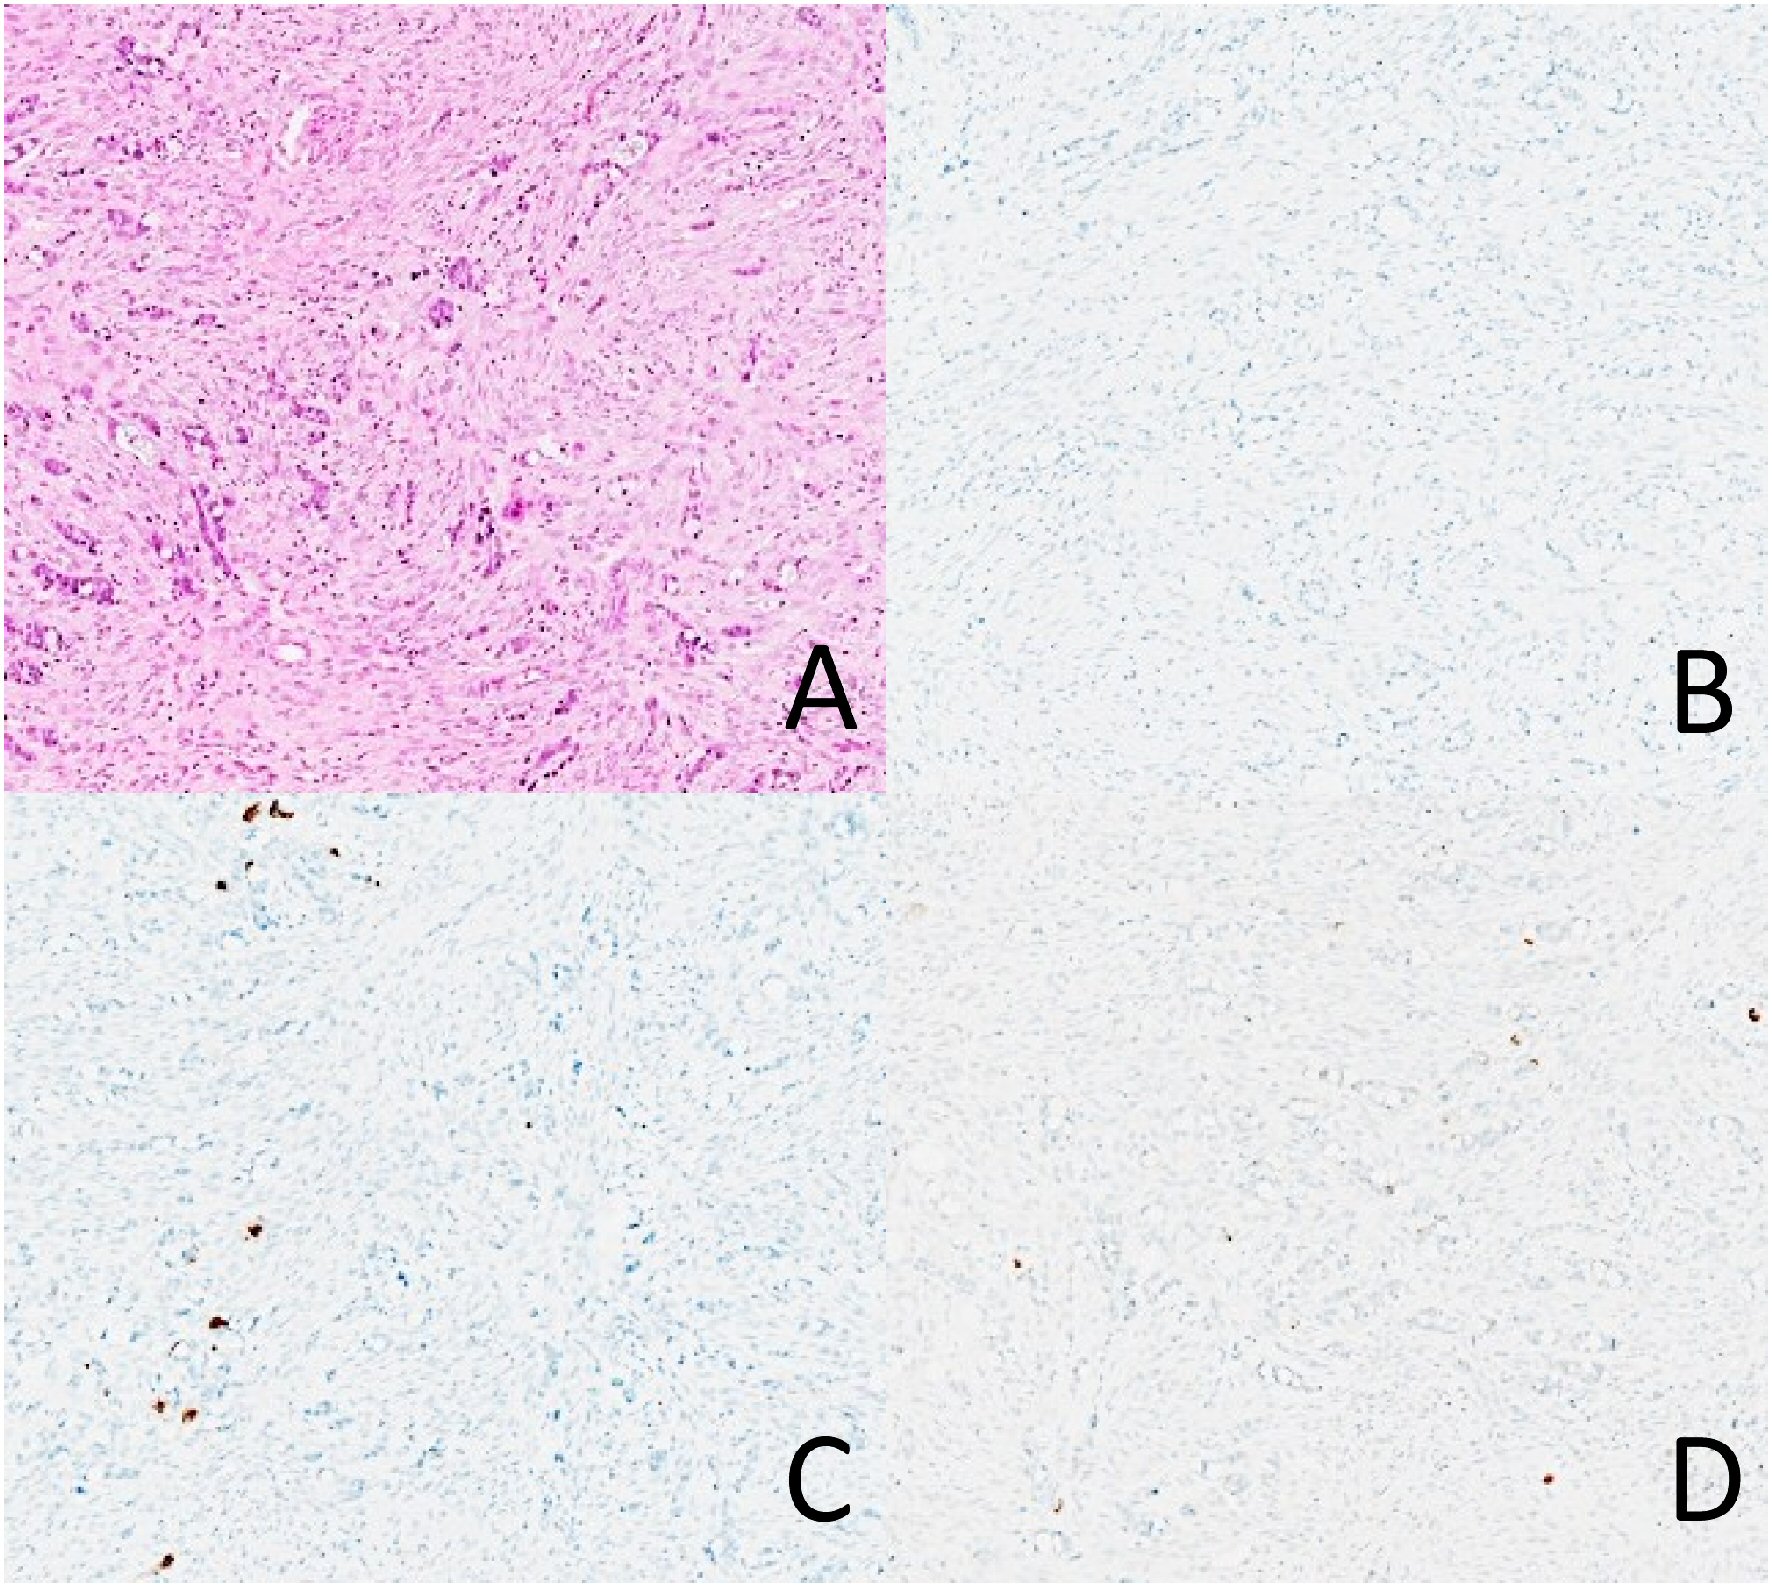
Figure 3. A case of adenocarcinoma ex-goblet cell carcinoid with weak positive staining for chromogranin and synaptophysin, but negative for INSM1. Note that chromogranin and synaptophysin are only expressed in a small proportion of tumor cells. (A) Hematoxylin and eosin. (B) INSM1. (C) Chromogranin. (D) Synaptophysin.

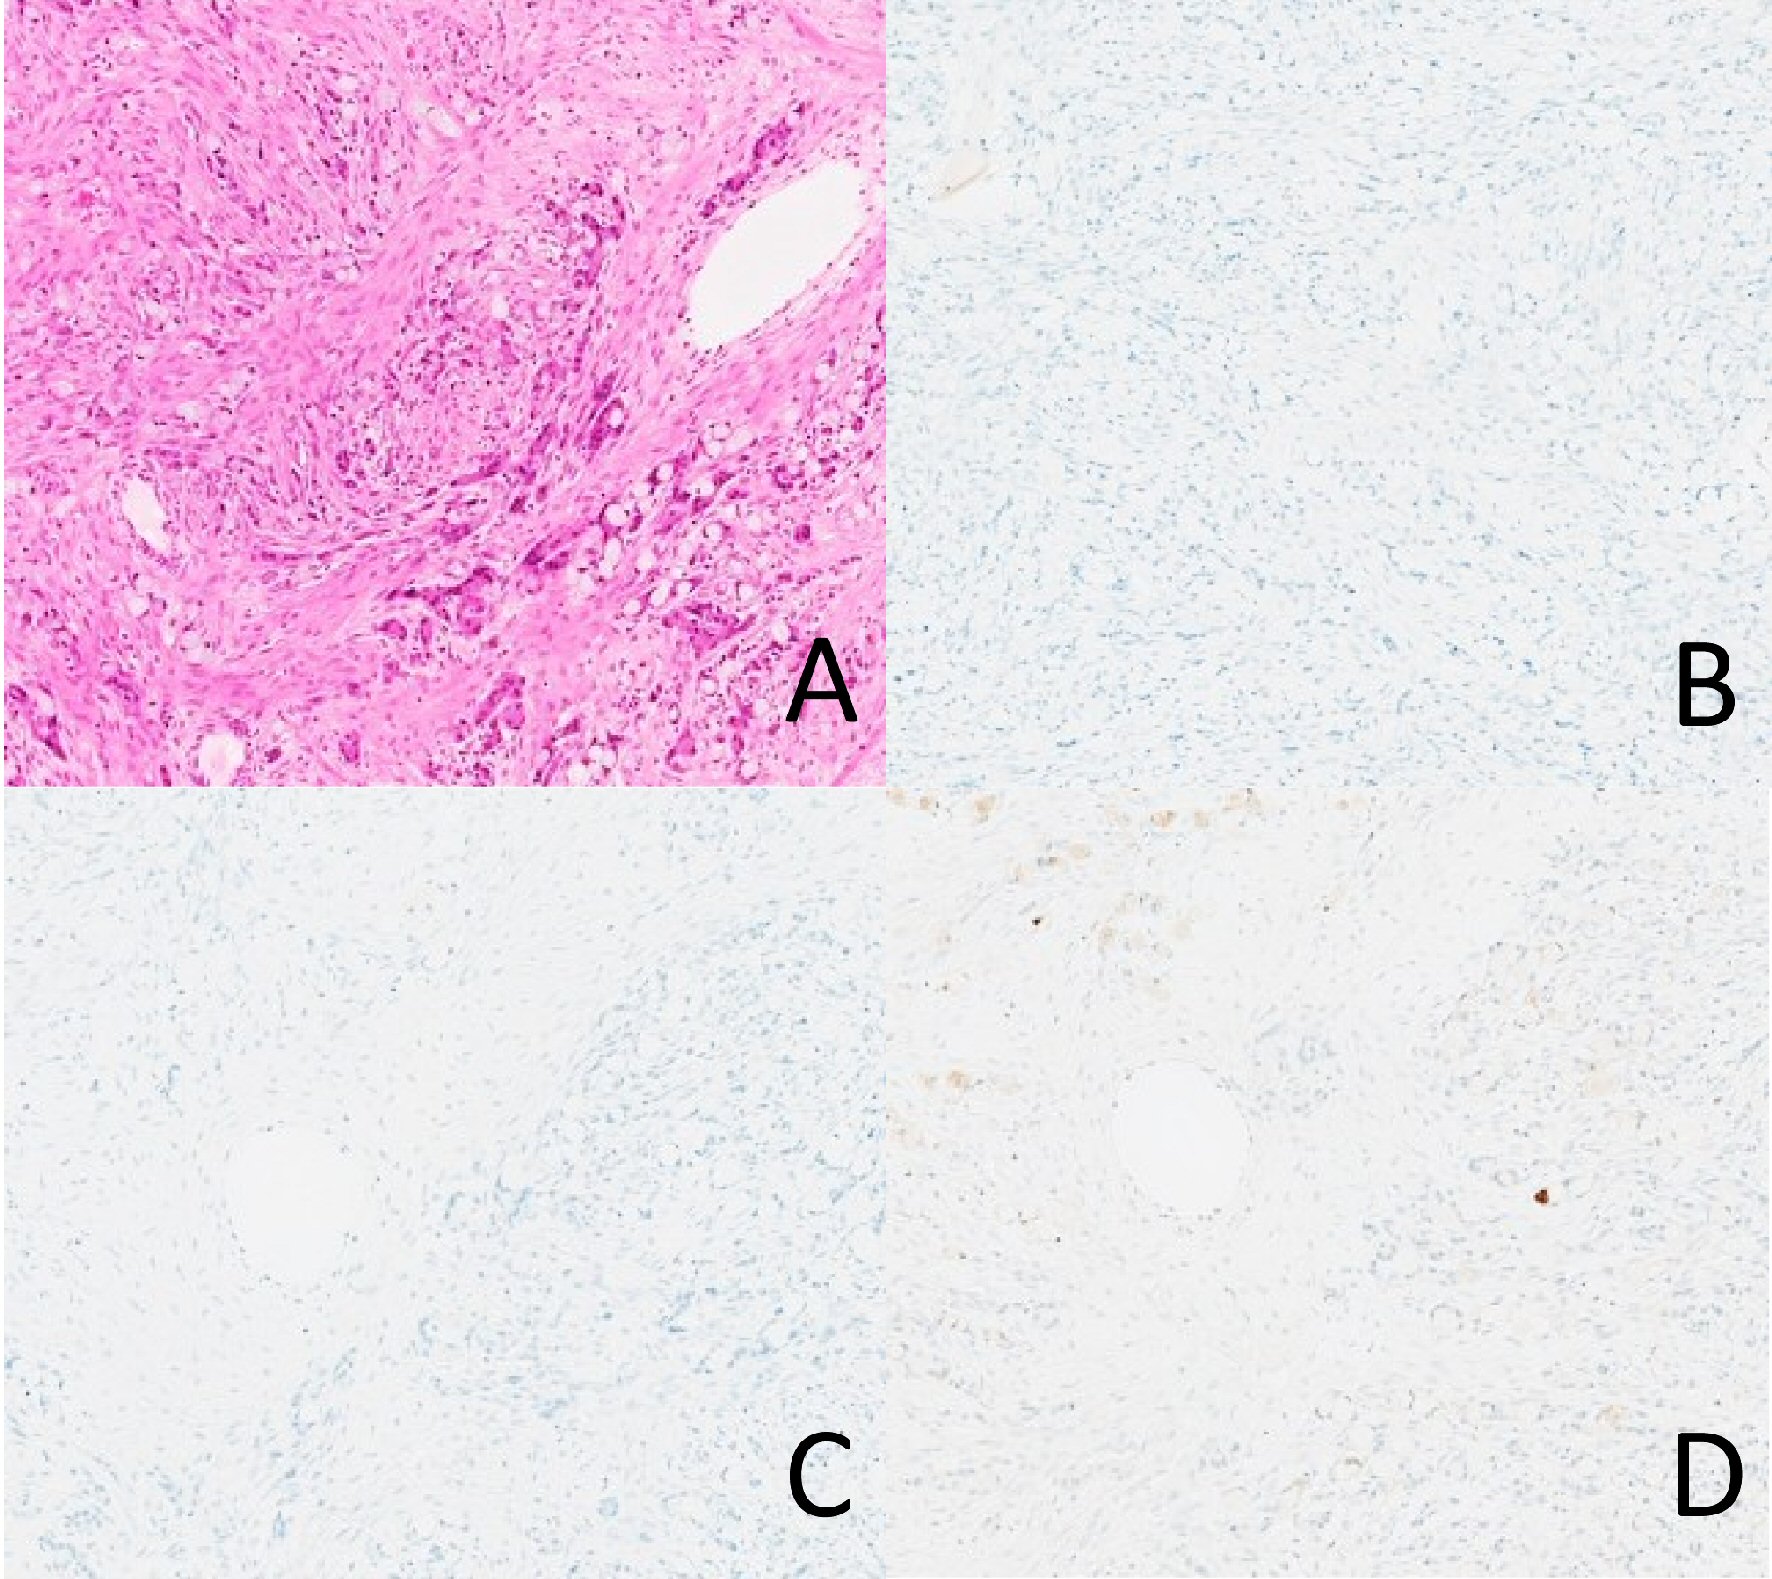
Figure 4. A case of adenocarcinoma ex-goblet cell carcinoid negative for INSM1, chromogranin, and synaptophysin. None of the tumor cells are staining with any of the markers. (A) Hematoxylin and eosin. (B) INSM1. (C) Chromogranin. (D) Synaptophysin.
Tables
Table 1. Primary Adenocarcinoma Ex-Goblet Cell Carcinoid Results (N = 21)
| 0 | 1+ | 2+ | 3+ | 4+ |
|---|
| CG: chromogranin; SYN: synaptophysin. Scoring criteria: 0 (< 1% cells staining), 1+ (1-25%), 2+ (26-50%), 3+ (51-75%), and 4+ (76-100%). |
| CG | 3 | 14 | 2 | 2 | 0 |
| SYN | 3 | 13 | 0 | 3 | 2 |
| INSM1 | 8 | 11 | 1 | 1 | 0 |
| CD56 | 10 | 8 | 1 | 0 | 0 |
Table 2. Metastatic Adenocarcinoma Ex-Goblet Cell Carcinoid Results (N = 15)
| 0 | 1+ | 2+ | 3+ | 4+ |
|---|
| CG: chromogranin; SYN: synaptophysin. Scoring criteria: 0 (< 1% cells staining), 1+ (1-25%), 2+ (26-50%), 3+ (51-75%), and 4+ (76-100%). |
| CG | 4 | 9 | 0 | 1 | 1 |
| SYN | 3 | 9 | 1 | 1 | 1 |
| INSM1 | 7 | 8 | 0 | 0 | 0 |
| CD56 | 11 | 3 | 0 | 0 | 0 |


