Figures
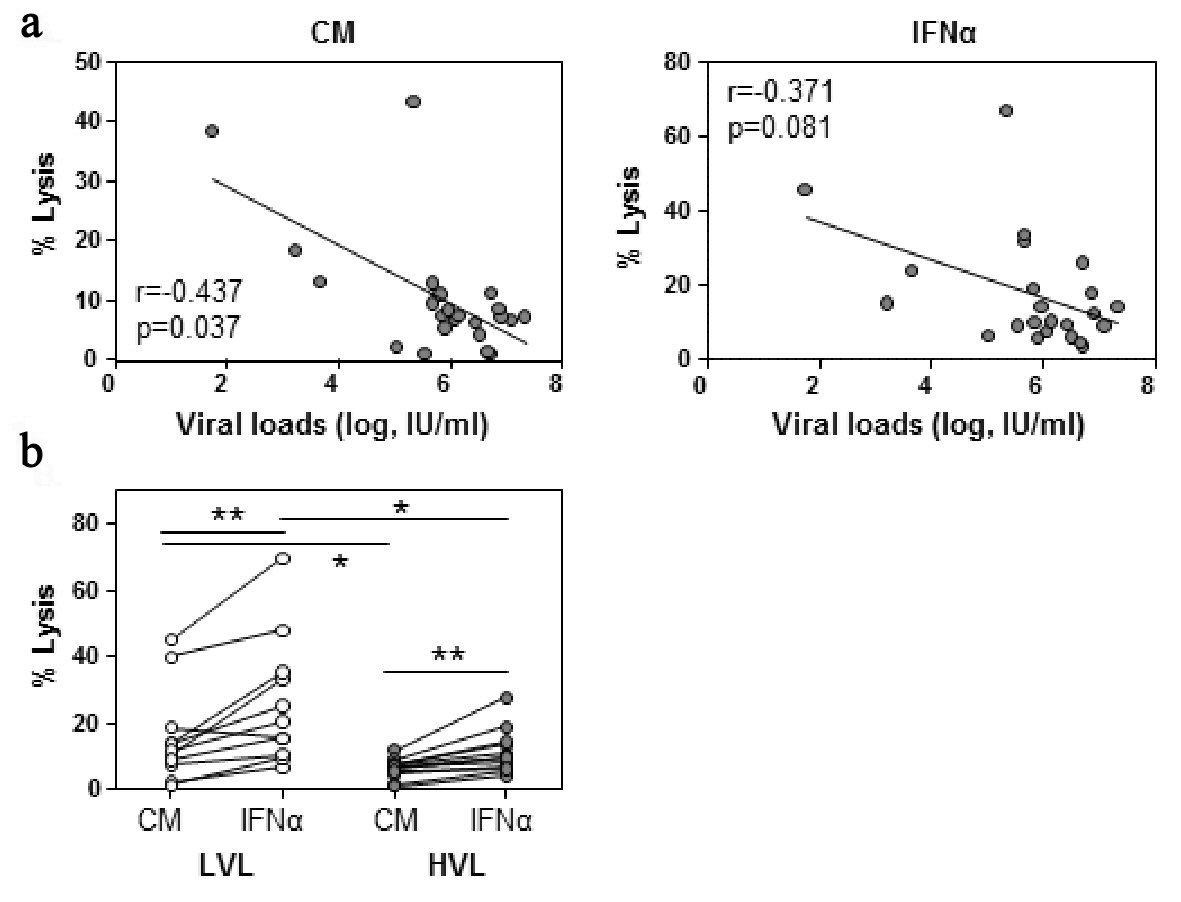
Figure 1. NK cell cytotoxicity decreases with viral load. PBMC were incubated overnight in culture medium (CM) and IFN-α. NK cell cytotoxicity was measured by Cr-51 release assay. (a) Baseline viral loads were plotted against NK cell cytotoxicity at an E:T ratio of 12.5:1 ratio following CM or IFN-α incubation. Spearman rank correlation, r, is shown. (b) Baseline NK cell cytotoxicity was evaluated between low viral load (LVL) and high viral load (HVL) patients. Lines indicate one patient’s values for each condition. Within cohort significant differences between CM and IFN-α were determined by paired t-test. Between cohorts significant differences were determined by Mann-Whitney U test. Significant differences are indicated as *P < 0.05, **P < 0.01.
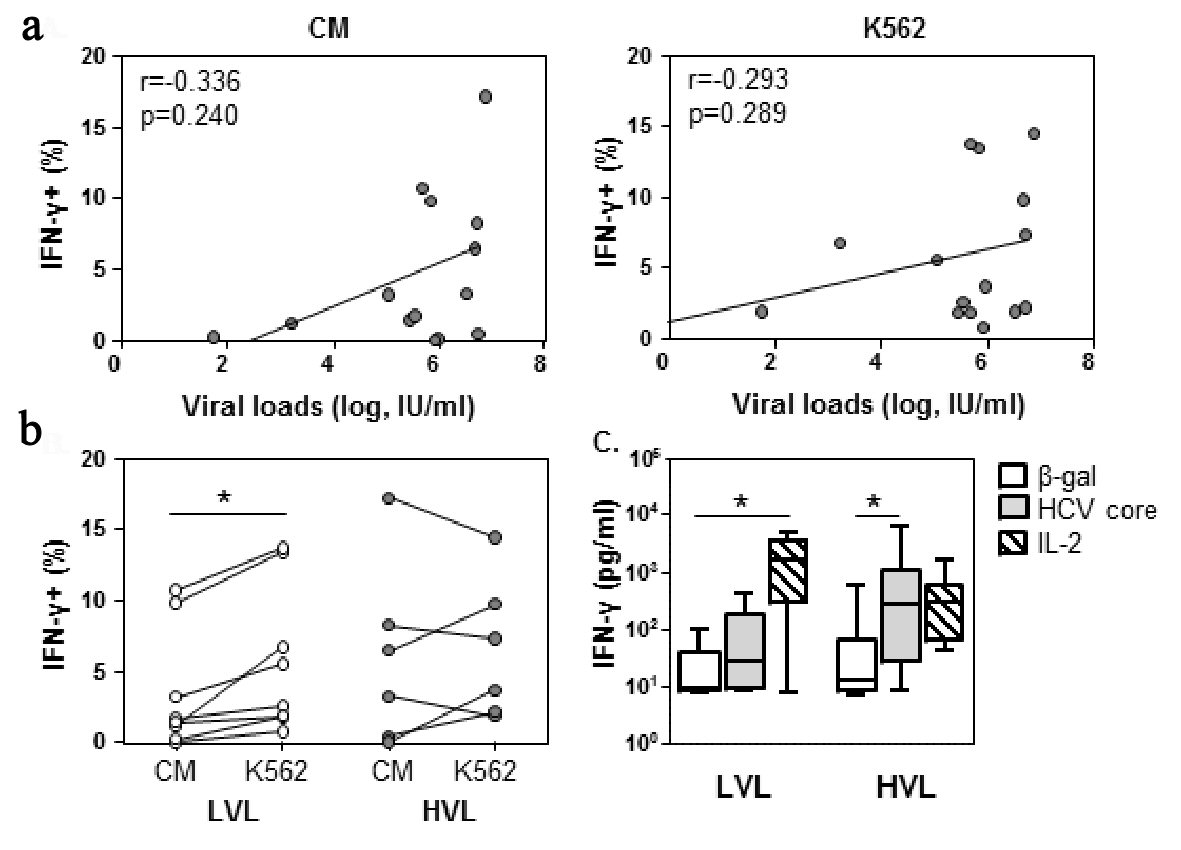
Figure 2. NK cells at low viral loads can be further stimulated towards IFN-γ expression by target cells. PBMC were incubated with CM or K562 target cells for 6 h in the presence of brefeldin A, and then stained for IFN-γ expression. (a) IFN-γ expression was assessed against viral load. Spearman rank correlation, r, is shown. P < 0.05 is considered significant. (b) The percent of NK cells producing IFN-γ was evaluated for LVL and HVL cohorts. Lines indicate an individuals values for each condition. Within cohort significant differences between CM and K562 were determined by paired t-test. Between cohorts significant differences were determined by Mann-Whitney U-test. (c) PBMCs were cultured with β-gal, core or IL-2 as indicated. Supernatants were collected at 72 h and analyzed for IFN-γ levels in LVL (n = 6) and HVL (n = 11). Statistical evaluation for changes in IFN-γ levels within a cohort was determined by ANOVA, repeated measures. Significant differences are indicated as *P < 0.05.
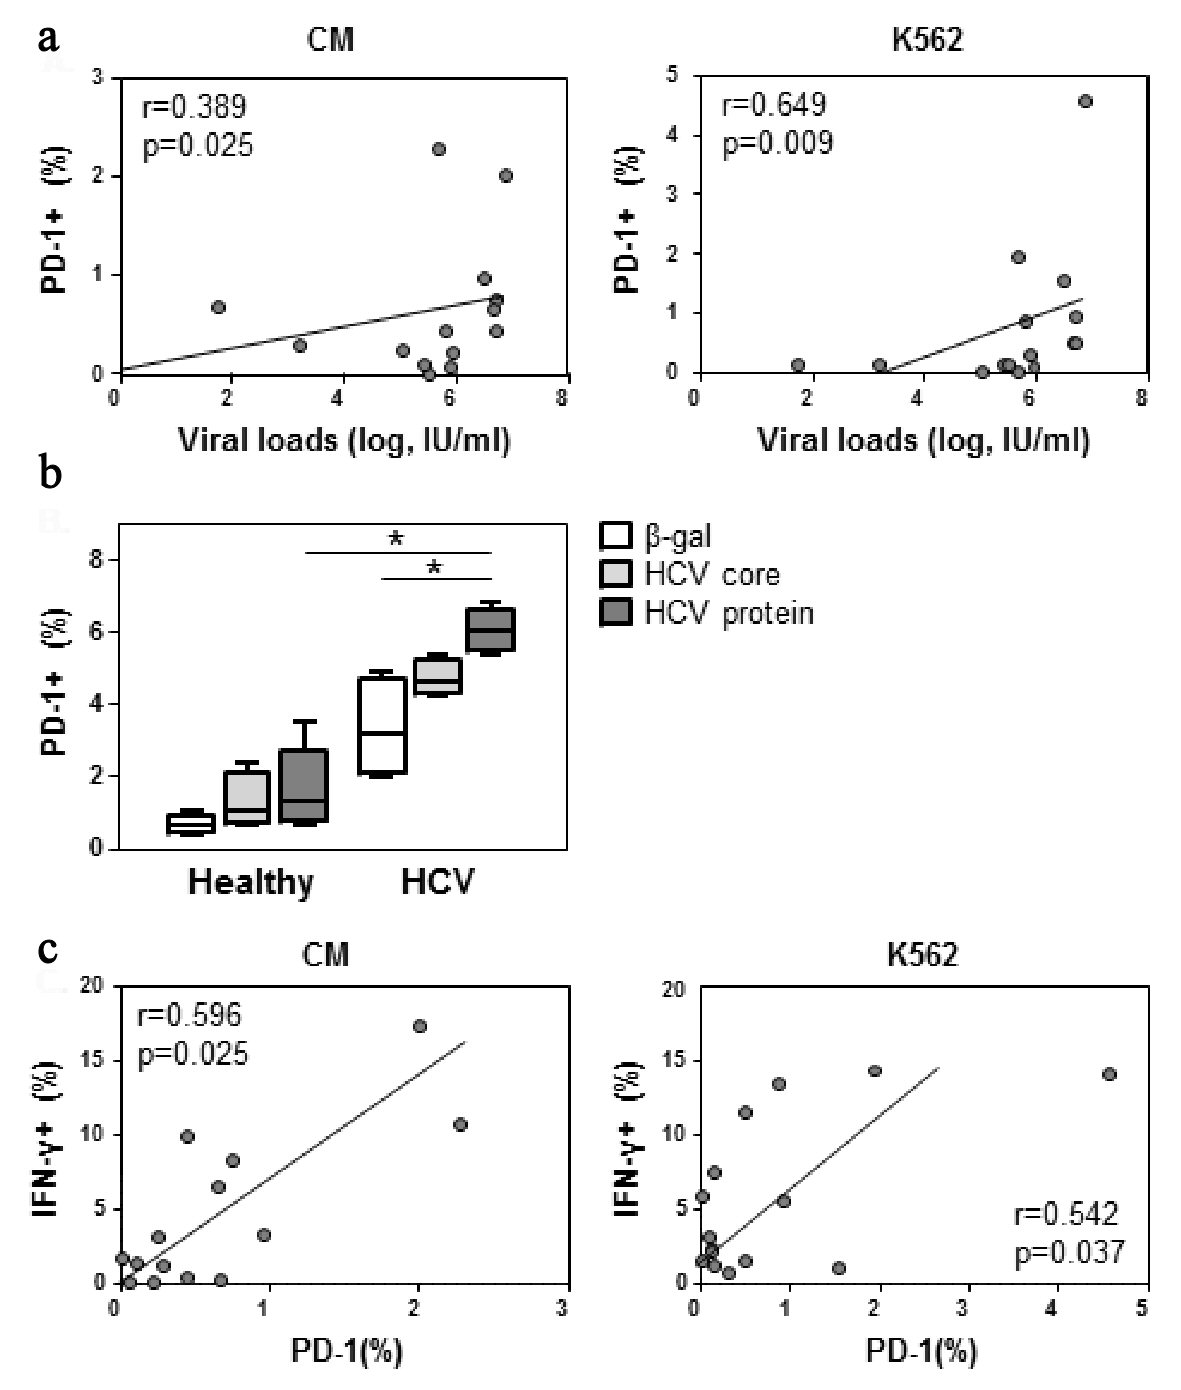
Figure 3. PD-1 expression correlates with viral load. (a) PBMCs were incubated with CM or K562 target cells as per Figure 2. Cells were stained for CD56 and PD-1 expression. NK cell PD-1 expression was assessed against viral load. (b) PBMCs were cultured with 1 µg/mL of β-gal, core, or a HCV protein cocktail of core, NS3 and NS4 or IL-2 (1,000 IU) as indicated. Cells were harvested at 24 h and stained for PD-1 expression. Four replicates from one experiment shown. (c) As per panel a, cells were also stained for CD56, PD-1 and IFN-γ expression. Significant differences are indicated as *P < 0.05.
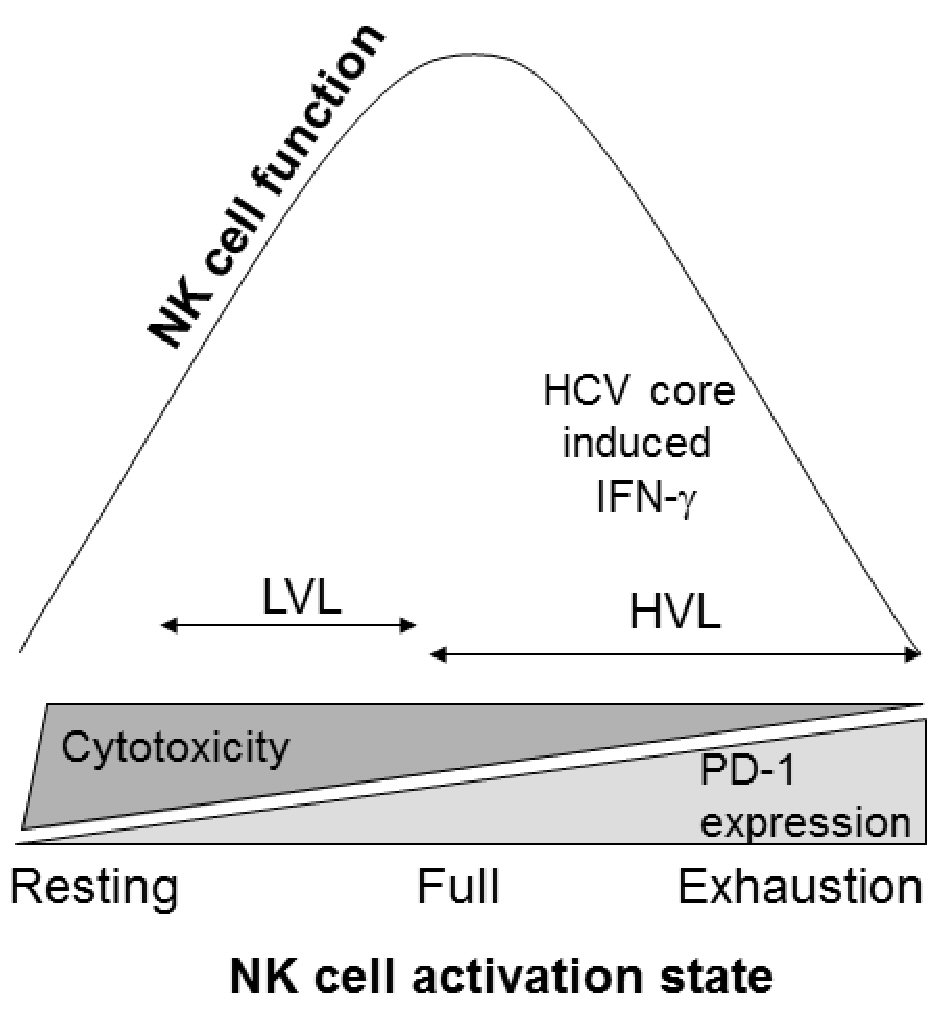
Figure 4. NK cell activation state and function. Cellular activation states move from resting to exhaustion. During LVLs, NK cells appear capable of being further activated allowing for greater NK cell cytotoxicity, along with a capacity for IFN-γ production upon additional stimulation. At HVLs, the constant activation drives the cells towards exhaustion, impairing their ability to function.