Figures
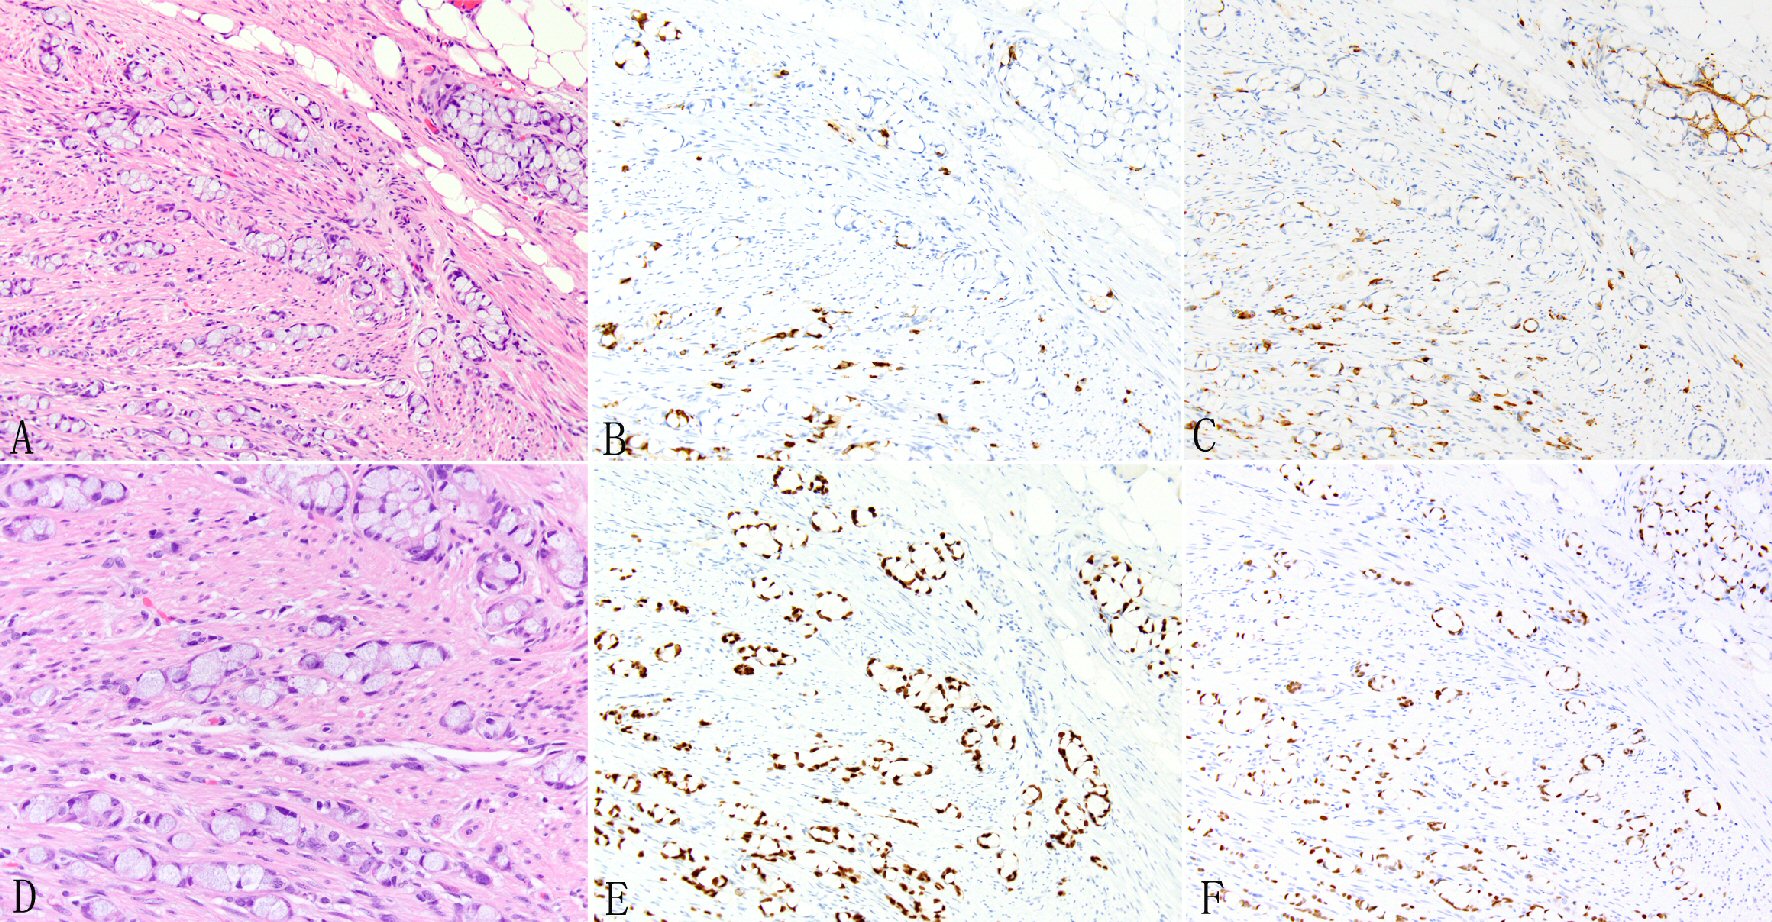
Figure 1. Expression of SATB2 in appendiceal goblet cell carcinoids. Goblet cell carcinoid is morphologically characterized by well-defined goblet cells in clusters or cohesive linear fashion infiltrating appendiceal wall and peri-appendiceal soft tissue (A, D). The tumor cells often show focal chromogranin (B) and synaptophysin (C) staining but diffuse staining for CDX2 (E) and SATB2 (F).
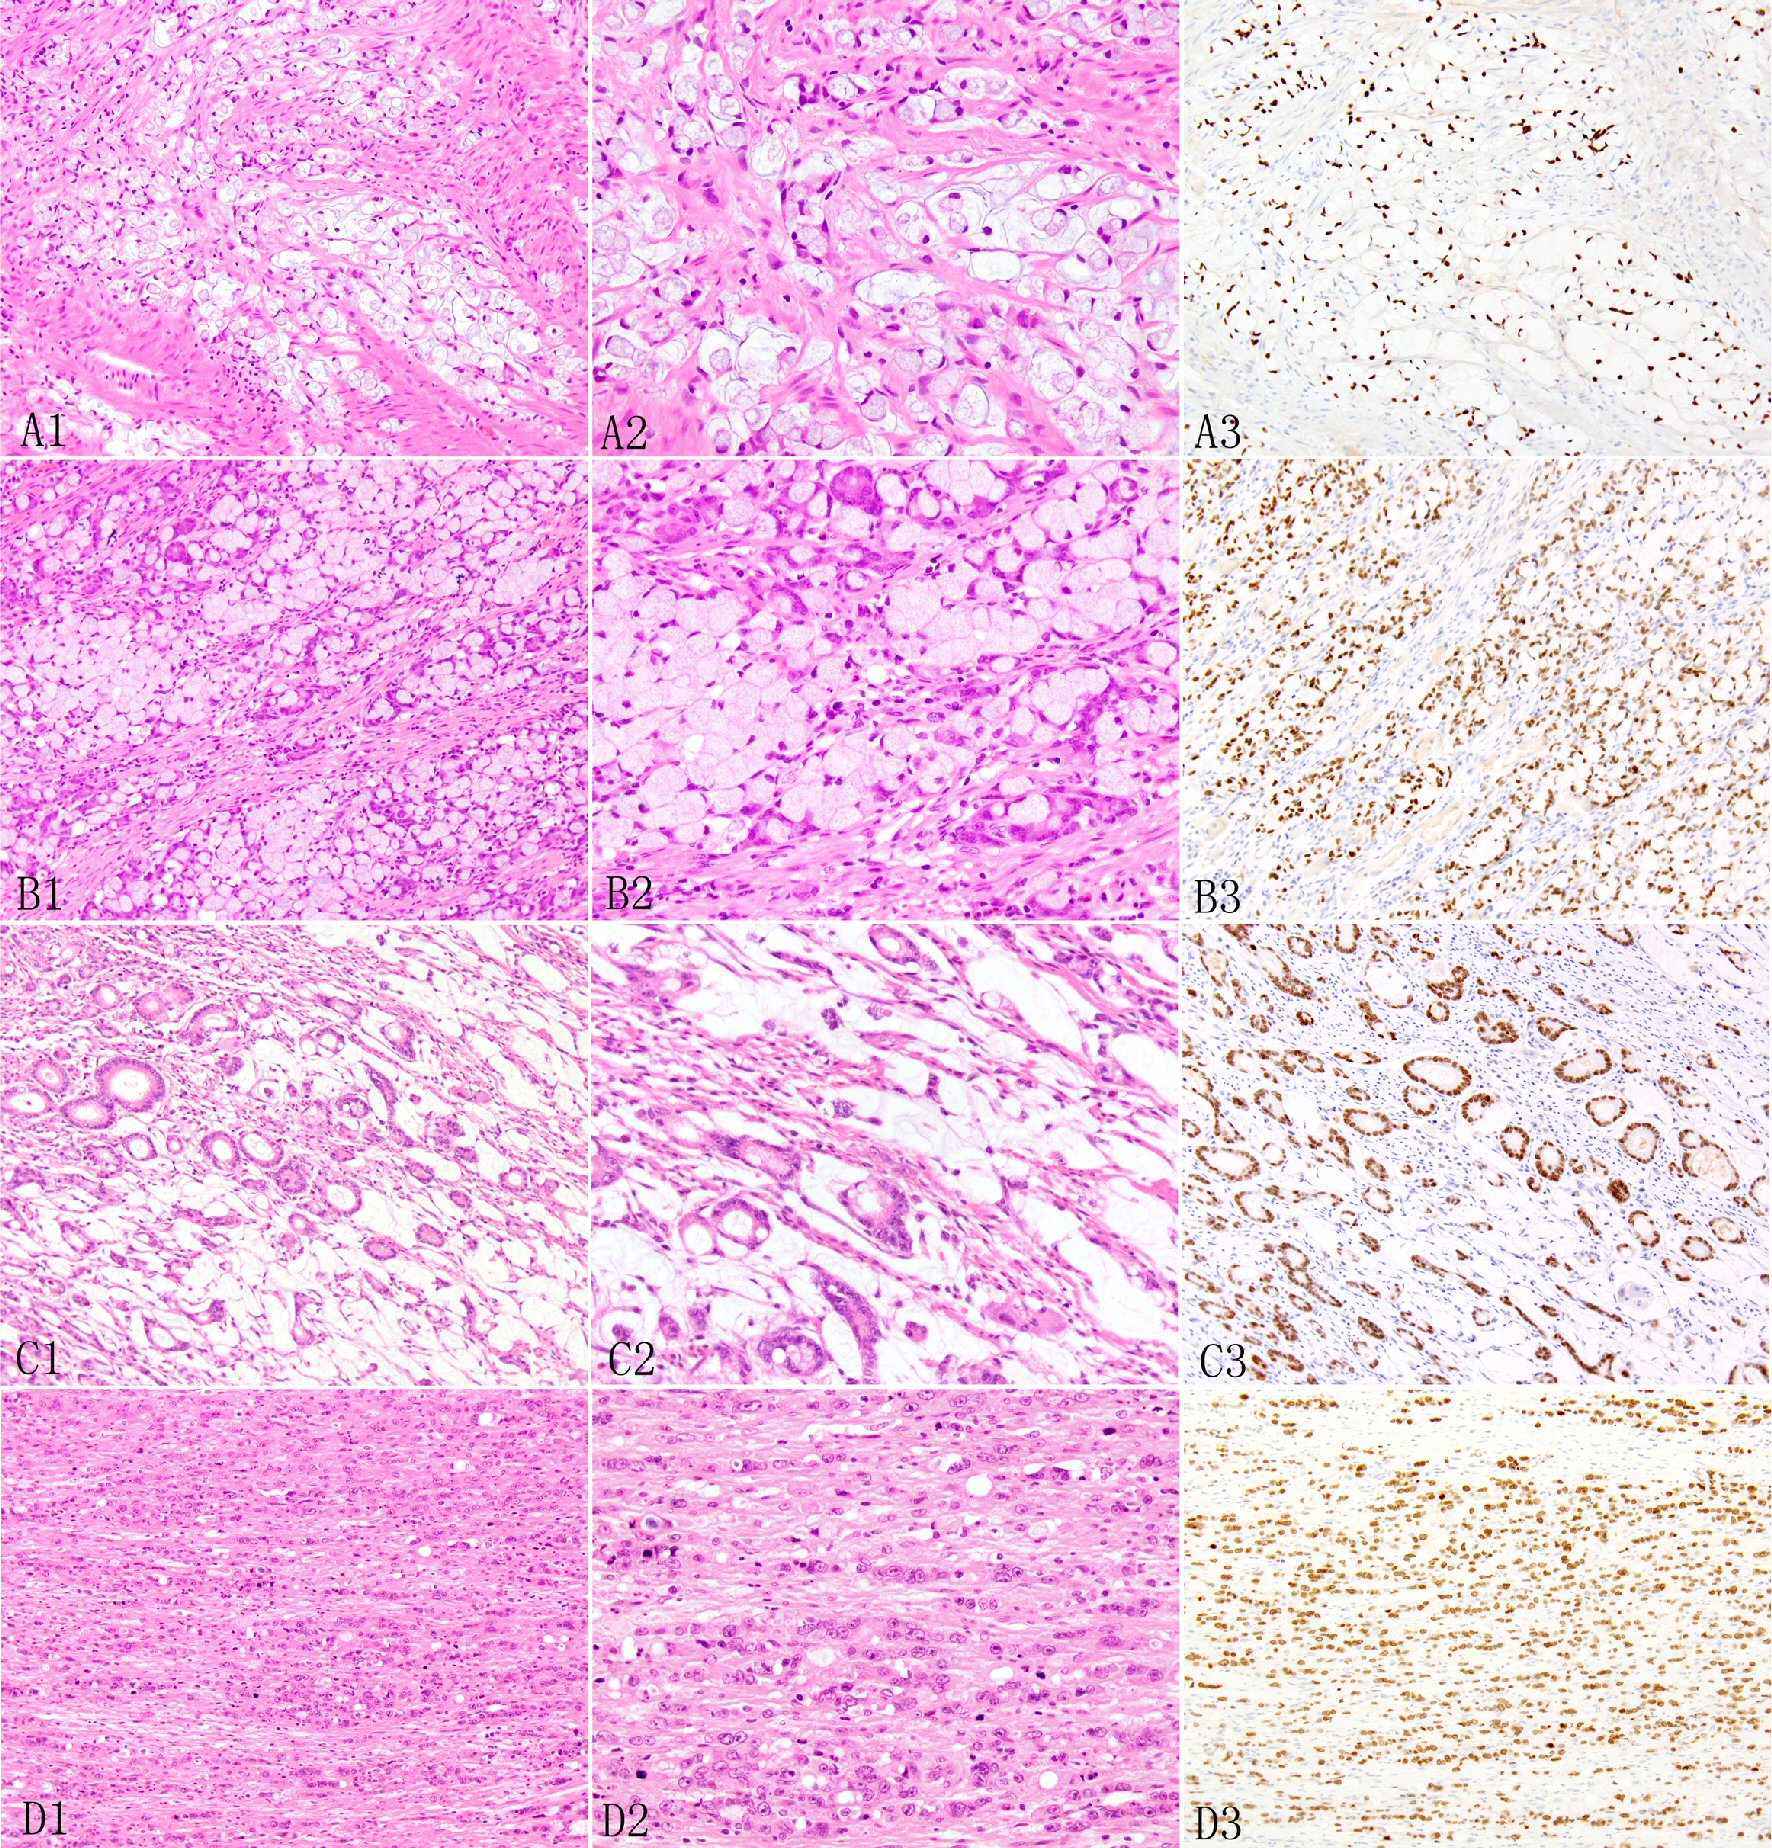
Figure 2. Expression of SATB2 in appendiceal adenocarcinoma ex goblet cell carcinoid. The signet ring cell type may show desmoplastic stroma and extracellular mucin pools (A1, A2) and irregular large nests and sheet (B1, B2). In the poorly differentiated adenocarcinoma type, the invasive adenocarcinoma may manifest as tubular glands (C1, C2) or individual to clusters to small nested undifferentiated cells with focal small glandular lumen (D1, D2). The invasive adenocarcinoma cells show diffuse SATB2 staining (A3, B3, C3, D3).
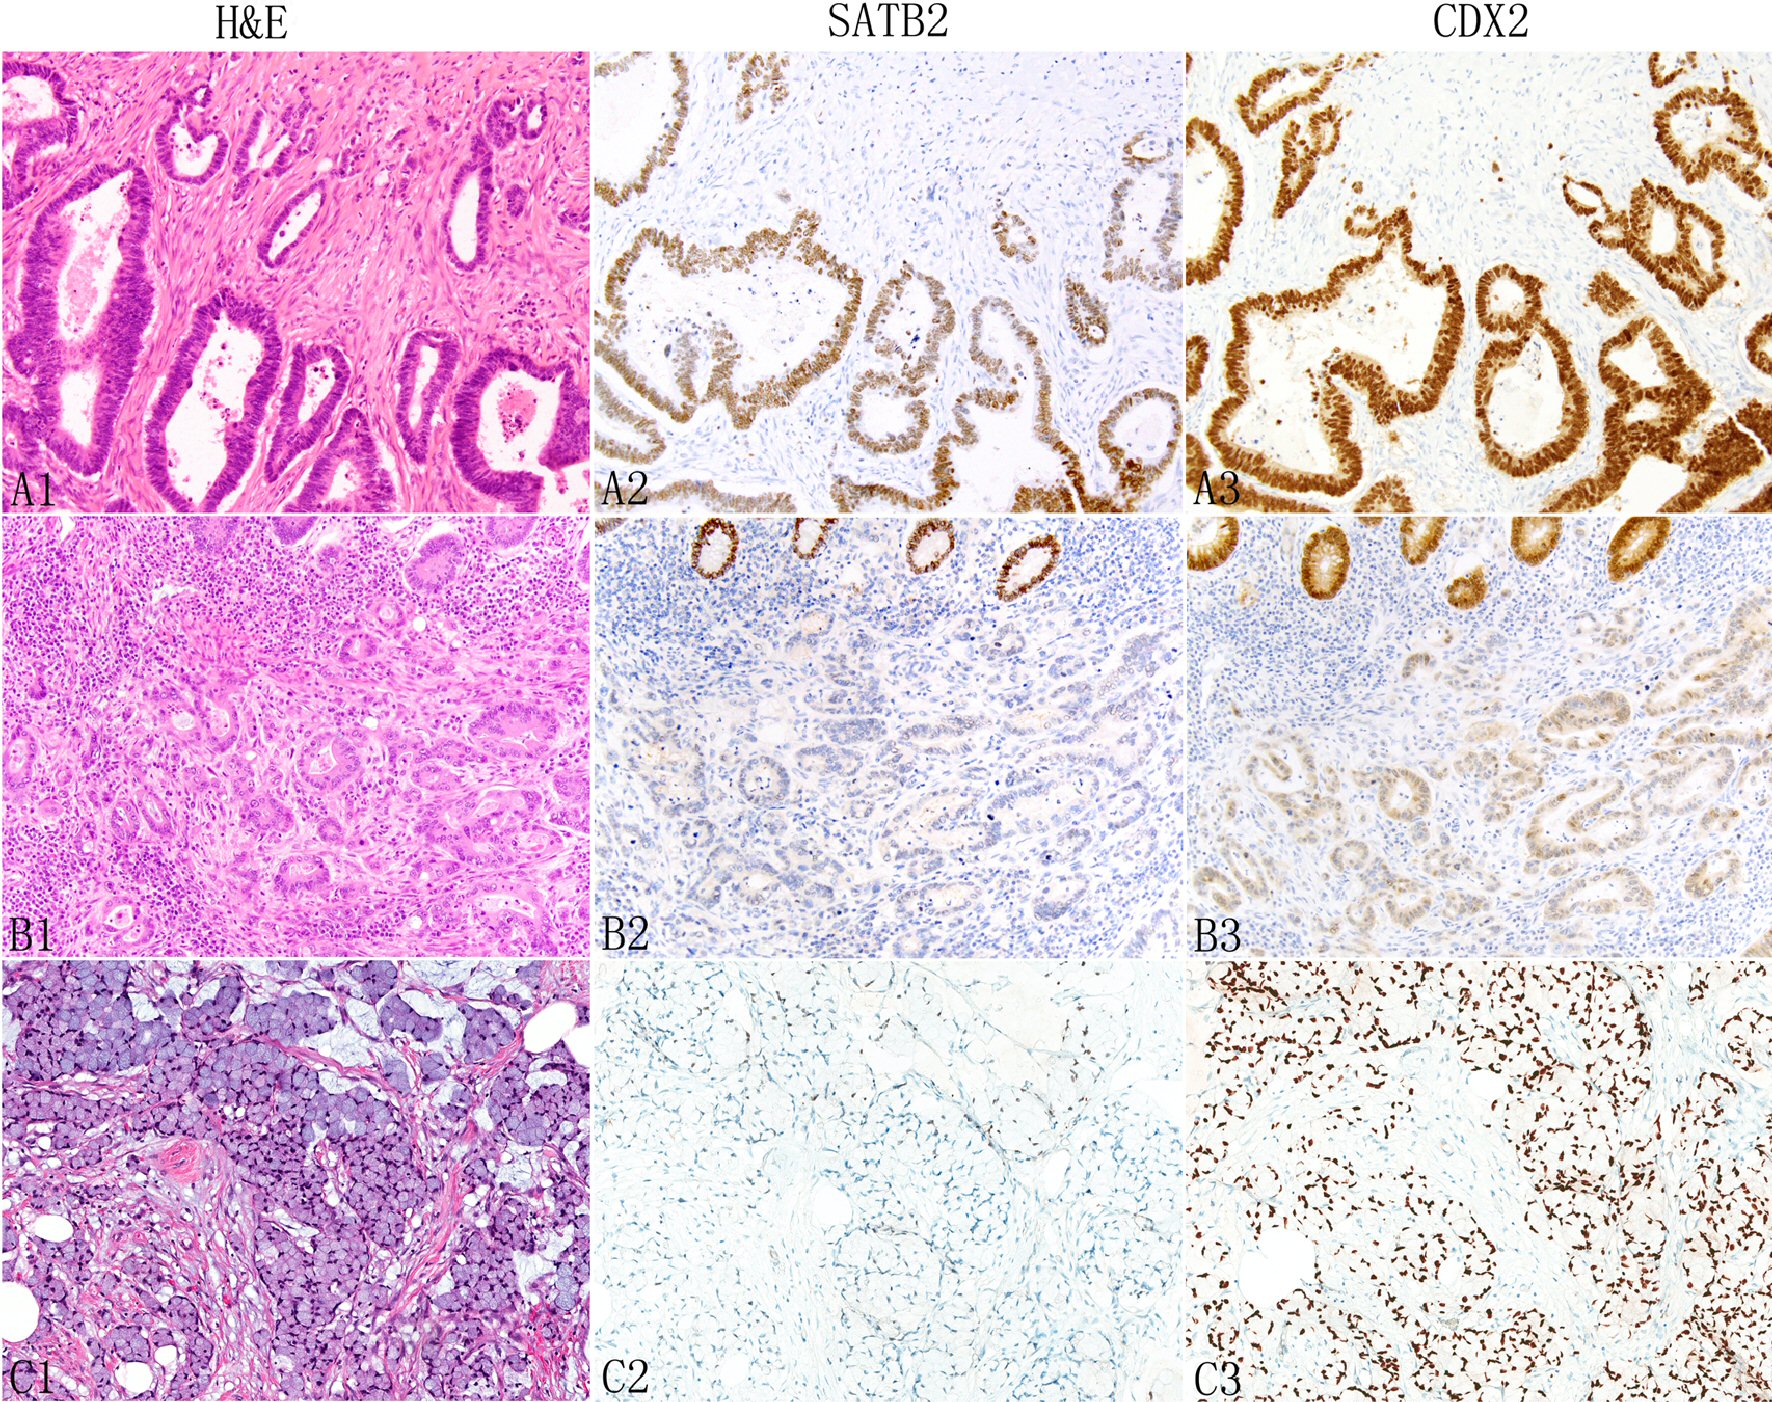
Figure 3. Expression of SATB2 and CDX2 in appendiceal conventional adenocarcinomas. The neoplastic glands typically show more SATB2 staining than non-glandular components such as individual tumor cells (A1: H&E, A2: SATB2). In some tumors, both glandular and non-glandular components may lose SATB2 expression (B1: moderately differentiated adenocarcinoma; B2: SATB2, top shows normal glands with strong SATB2 staining). Signet ring cells (C1) are also associated with decreased SATB2 staining (C2). In contrast, CDX2 typically shows diffuse strong staining (A3 and C3) with occasional focal weak staining (B3).
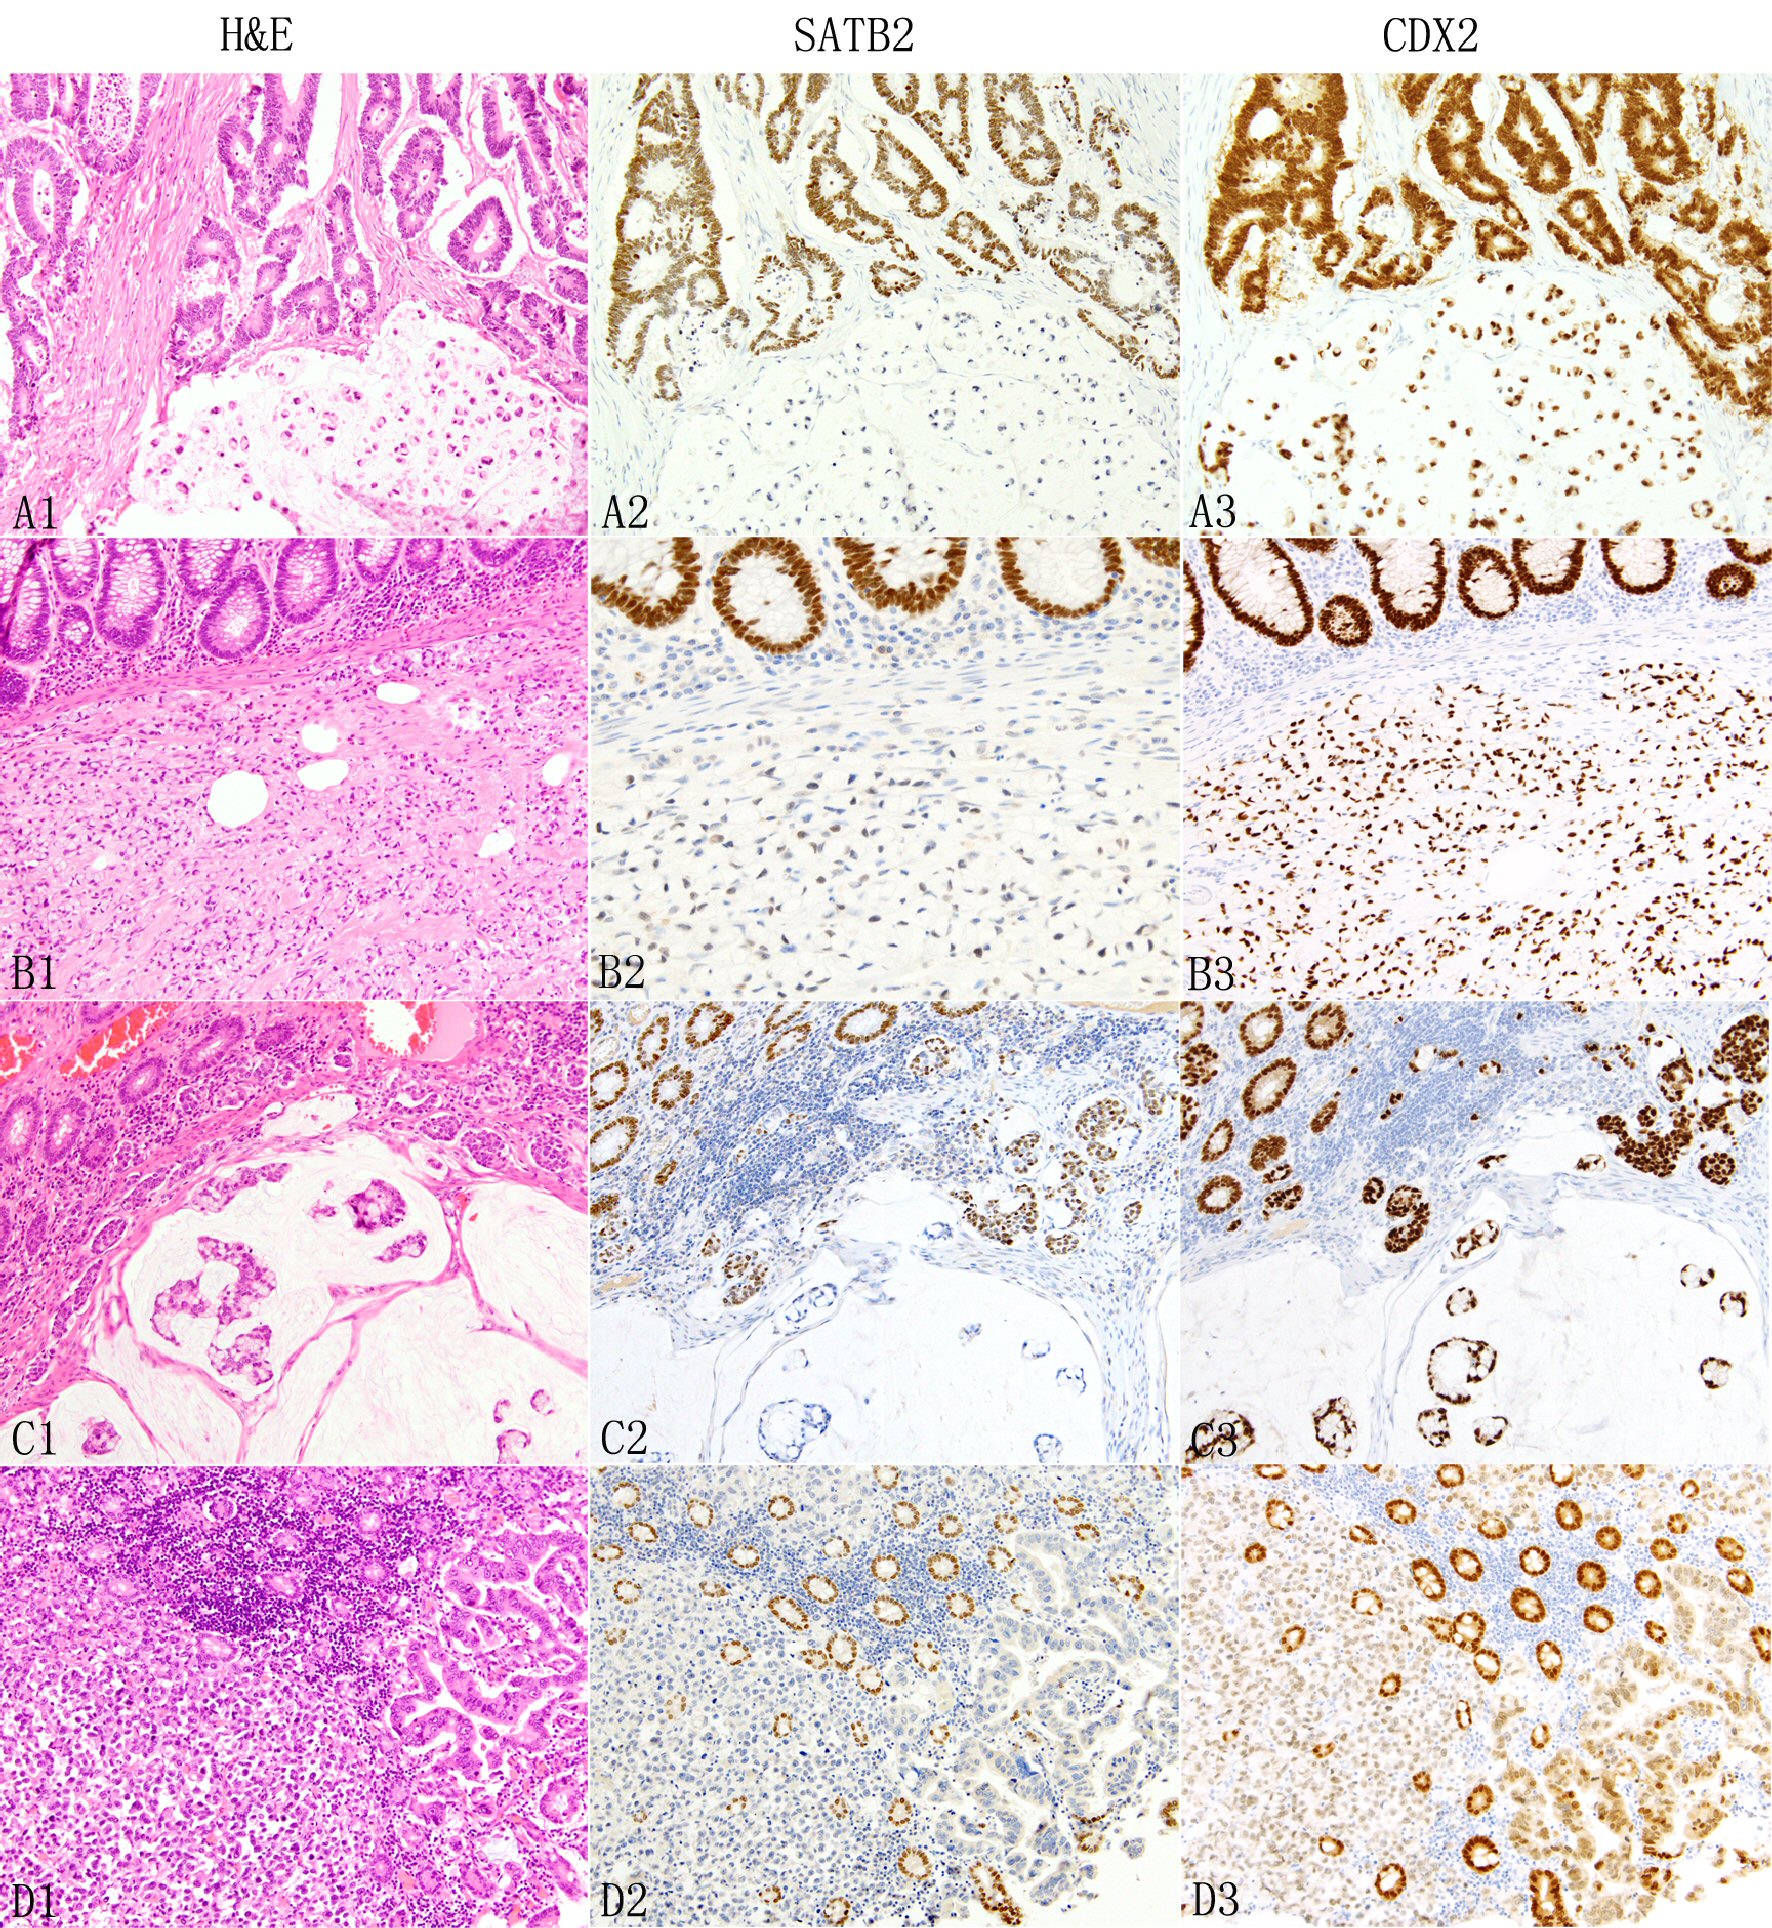
Figure 4. Expression of SATB2 and CDX2 in colorectal adenocarcinomas. In colorectal adenocarcinomas, the neoplastic glands (A1 top) typically show diffuse strong SATB2 staining (A2) but signet ring cells, either admixed with glands (A1 bottom) or pure (B1) are associated with absent (A2 bottom) or decreased/weak (B2) SATB2 immunoreactivity. The presence of colloid carcinoma component (C1 bottom) is often associated with decreased or absent SATB2 staining (C2 botttom). Non-glandular non-signet ring cell component such as single cells, clusters and nests (C1, D1) are also associated with decreased (C2 middle) or absent (D2) SATB2 immunoreactivity. In D1, the neoplastic glands next to the discohesive tumor cells are also negative for SATB2 staining (D2). The background benign colonic glands show strong diffuse SATB2 staining (B2 to D2). In contrast, CDX2 demonstrates consistently diffuse staining across different growth patterns, mostly strong (A3 to C3) with occasional weak (D3) staining.
Tables
Table 1. Expression of SATB2 and CDX2 in 23 Appendiceal Conventional Adenocarcinomas
| Tumor differentiation | SATB2 | CDX2 | P value |
|---|
| 0 | 1+ | 2+ | 3+ | 4+ | 0 | 1+ | 2+ | 3+ | 4+ |
|---|
| A = well differentiated (N = 7) | 1 (14%) | 1 (14%) | 1 (14%) | 2 (29%) | 2 (29%) | 0 | 0 | 0 | 1 (14%) | 6 (86%) | 0.2167 |
| B = moderately differentiated (N = 8) | 4 (50%) | 1 (12.5%) | 1 (12.5%) | 1 (12.5%) | 1 (12.5%) | 0 | 1 (12.5%) | 0 | 1 (12.5%) | 6 (75%) | 0.02 |
| C = poorly differentiated (N = 8) | 3 (38%) | 1 (12.5%) | 2 (25%) | 2 (25%) | 0 | 1 (12.5%) | 0 | 0 | 0 | 7 (87.5%) | 0.001 |
| Total (N = 23) | 8 (35%) | 3 (13%) | 4 (17%) | 5 (22%) | 3 (13%) | 1 (4%) | 1 (4%) | 0 | 2 (8%) | 19 (83%) | 0.001 |
| P value | A vs. B: 0.6607 | A vs. B: 0.6257 | |
| A vs. C: 0.5119 | A vs. C: 0.60 | |
| B vs. C: 0.7707 | B vs. C: 0.60 | |
Table 2. Expression of SATB2 and CDX2 in 57 Colorectal Adenocarcinomas
| Tumor differentiation | SATB2 | CDX2 | P value |
|---|
| 0 | 1+ | 2+ | 3+ | 4+ | 0 | 1+ | 2+ | 3+ | 4+ |
|---|
| A = well differentiated (N = 11 ) | 0 | 0 | 1 (9%) | 1 (9%) | 9 (82%) | 0 | 0 | 0 | 1 (9%) | 10 (91%) | 0.5901 |
| B = moderately differentiated (N=19) | 4 (21%) | 1 (5%) | 4 (21%) | 2 (11%) | 8 (42%) | 1 (5%) | 0 | 0 | 0 | 18 (95%) | 0.013 |
| C = poorly differentiated (N = 27) | 6 (22%) | 9 (33%) | 6 (22%) | 3 (11%) | 3 (11%) | 0 | 1 (4%) | 1 (4%) | 1 (4%) | 24 (89%) | 1.0E-6 |
| Total (N = 57) | 10 (18%) | 10 (18%) | 11 (18%) | 6 (11%) | 20 (35%) | 1 (2%) | 1 (2%) | 1 (2%) | 2 (4%) | 52 (91%) | < 0.00001 |
| P value | A vs. B: 0.1218 | A vs. B: 0.3139 | |
| A vs. C: 0.001 | A vs. C: 0.7411 | |
| B vs. C: 0.073 | B vs. C: 0.4667 | |
| A+B (low grade) vs. C (high grade): 0.002 | A+B (low grade) vs. C (high grade): 0.5316 | |
| A vs. B vs. C: 0.0009 | A vs. B vs. C: 0.7873 | |
Table 3. Comparison Between SATB2 and CDX2 in Appendiceal Adenocarcinomas and Colorectal Adenocarcinomas
| Tumor type | SATB2-positive cases | CDX2-positive cases | P value (positive cases) | Mean SATB2-positive tumor cells (median, range) | Mean CDX2-positive tumor cells (median, range) | P value (mean positive tumor cells) |
|---|
| A = appendiceal adenocarcinomas ex goblet cell carcinoids (N = 26) | 26/26 (100%) | 26/26 (100%) | 1.0 | 93% (95%, 50-100%) | 98% (100%, 95-100%) | 0.02 |
| B = appendiceal conventional adenocarcinoma (N = 23) | 15/23 (65%) | 22/23 (96%) | 0.01 | 34% (30%, 0-95%) | 84% (95%, 0-100%) | < 0.00001 |
| C = colorectal adenocarcinomas (N = 57) | 47/57 (82%) | 56/57 (98%) | 0.004 | 48% (50%, 0-100%) | 91% (100%, 0-100%) | < 0.00001 |
| P value | A vs. B: 0.001 | A vs. B: 0.4694 | | A vs. B: < 0.00001 | A vs. B: 0.011 | |
| A vs. C: 0.03 | A vs. C: 1.0 | | A vs. C: < 0.00001 | A vs. C: 0.075 | |
| B vs. C: 0.1379 | B vs. C: 0.4949 | | B vs. C: 0.1280 | B vs. C: 0.2074 | |